IMAGE

FIG. 1.

ID
ZDB-IMAGE-210113-92
Source
Figures for Cheng et al., 2020
Image
Figure Caption

FIG. 1.

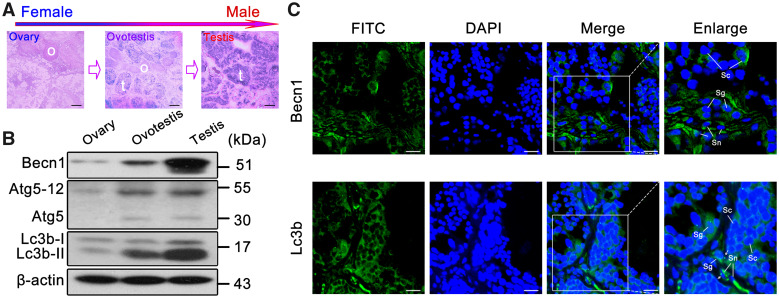
Upregulation of autophagy in testis. (A) H&E staining of the gonad tissues in Monopterus albus. The gonad transforms from ovary (o) to testis (t) via ovotestis during sex reversal. Scale bar: 100 μm. (B) Western blot analysis showed that Becn1, Atg5–Atg12, and Lc3b-II were upregulated during gonad transition. β-Actin was used as an internal control. (C) Immunofluorescence of the Lc3b and Becn1 proteins in testis using the anti-LC3B and anti-BECN1 antibodies followed by FITC-conjugated ImmunoPure goat anti-rabbit IgG (green). Lc3b was mainly expressed in the cytoplasm of Sertoli cells (Sn), spermatogonia (Sg), and spermatocytes (Sc) in testis. Lc3b-II puncta were detected in Sertoli cells and spermatogonia in testis (white arrows). Becn1 was expressed in Sertoli cells, spermatogonia, and spermatocytes in testis. The nuclei were revealed using DAPI fluorescence (blue). Images were captured using confocal microscopy. The enlarged images originated from the white squares. Scale bar: 10 μm.

Acknowledgments
This image is the copyrighted work of the attributed author or publisher, and ZFIN has permission only to display this image to its users. Additional permissions should be obtained from the applicable author or publisher of the image. Full text @ Mol Bio Evol