
IMAGE
Figure 1—figure supplement 1.
- ID
- ZDB-IMAGE-210113-56
- Publication
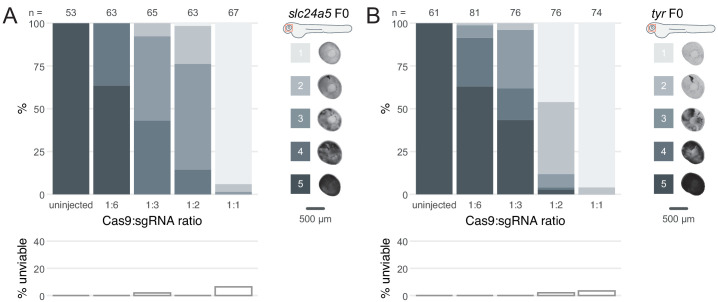
- Kroll et al., 2021 - A simple and effective F0 knockout method for rapid screening of behaviour and other complex phenotypes
- All Figures
- Figures for Kroll et al., 2021
Image
|
Figure Caption
Figure 1—figure supplement 1.
(
Acknowledgments
This image is the copyrighted work of the attributed author or publisher, and
ZFIN has permission only to display this image to its users.
Additional permissions should be obtained from the applicable author or publisher of the image.
Full text @ Elife