IMAGE

Fig. 1.

ID
ZDB-IMAGE-210113-127
Source
Figures for de Vos et al., 2020
Image
Figure Caption

Fig. 1.

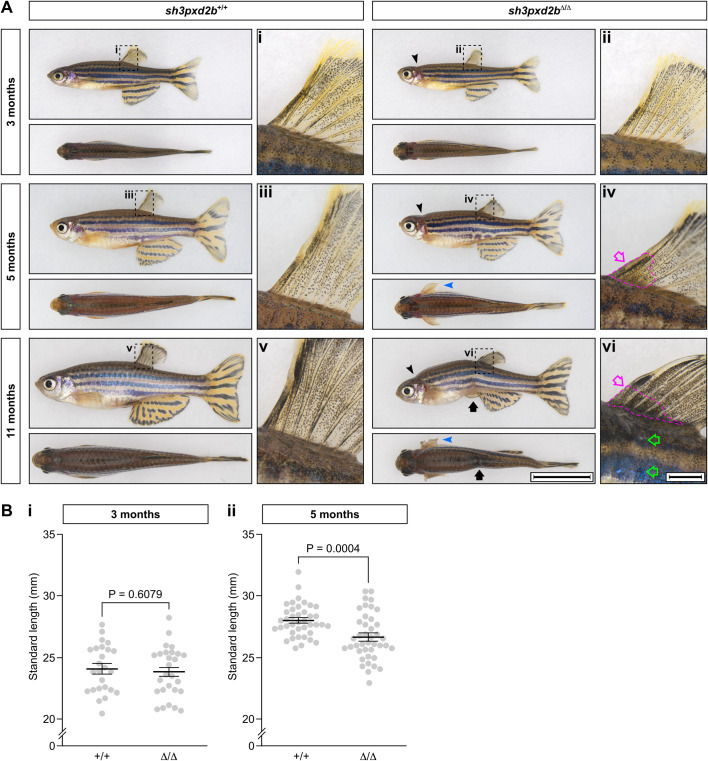
Adult sh3pxd2bΔ/Δ zebrafish have a gradually worsening phenotype, affecting skeletal structures and skin. (A) Representative images of sh3pxd2bΔ/Δ mutant fish and their sh3pxd2b+/+ WT clutch mates at the ages of 3, 5 and 11 months, selected from a total of 44 analysed fish per genotype per time point (see Table 1), imaged with a Nikon SMZ25 stereomicroscope. At 3 months of age, mutants demonstrate a short, up-tilted head (black arrowhead) with short operculum, exposing the gills (visible as a red patch caudal to the operculum); these features are absent in their WT clutch mates. At the age of 5 months, the pectoral fins of mutants are stiff and constantly kept in abducted position (blue arrowhead). At the anterior base of their dorsal fin, an opaque spot can be observed (iv, magenta arrow) that is absent in younger mutants and WT fish (compare with i–iii). At 11 months of age, mutants demonstrate hyper-kyphosis and abdominal constriction (black arrow). The pectoral fins of mutants are stiff and show signs of physical damage in multiple individuals (blue arrowhead). The opaque spot at the base of the dorsal fin (vi, magenta outlined arrow) is larger at 11 months of age and is hyper-pigmented (compare with iv and v). Note the sharper angle of fin rays with the dorsum of the fish in mutants (iv,vi) as compared to WT clutch mates (iii,v), as a result of the inability of the fins to be abducted manually. The flank, ventral to the dorsal fin, shows a whitish discoloration (green outlined arrows) in mutants. Scale bar equals 10 mm in overview and 1 mm in dorsal fin close-up. (B) Standard length measurements of 25 WT and 27 mutant 3-month-old fish (i), and 40 WT and 41 mutant 5-month-old fish. While there is no statistically significant difference in mean standard length between mutants and WT clutch mates at 3 months of age (i), at the age of 5 months mutants are significantly shorter than their WT clutch mates (P=0.6079 and P=0.0004, respectively, as assessed by two-sampled, non-pooled, two-tailed Student's t-test). Error bars represent standard error of means of biological replicates.

Figure Data
Acknowledgments
This image is the copyrighted work of the attributed author or publisher, and ZFIN has permission only to display this image to its users. Additional permissions should be obtained from the applicable author or publisher of the image. Full text @ Biol. Open