
Image
|
Figure Caption
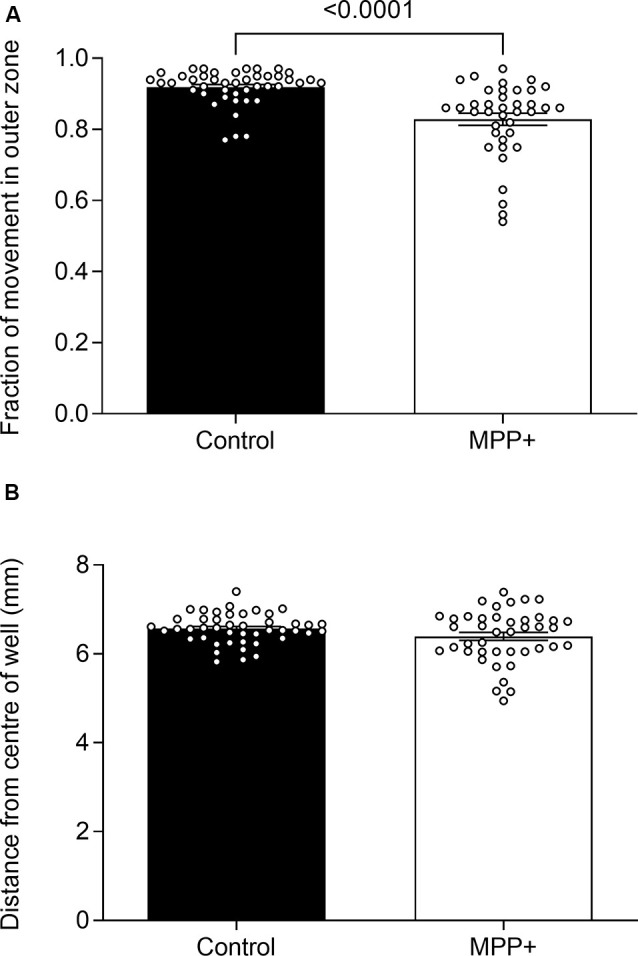
Figure 4
Effects of MPP+ on thigmotaxis. Thigmotaxis was evaluated at 6 dpf in the absence (Control) or presence of 500 μM MPP+ and represented as
Acknowledgments
This image is the copyrighted work of the attributed author or publisher, and
ZFIN has permission only to display this image to its users.
Additional permissions should be obtained from the applicable author or publisher of the image.
Full text @ Front. Behav. Neurosci.