IMAGE

FIGURE 4

ID
ZDB-IMAGE-210103-15
Source
Figures for Narumi et al., 2020
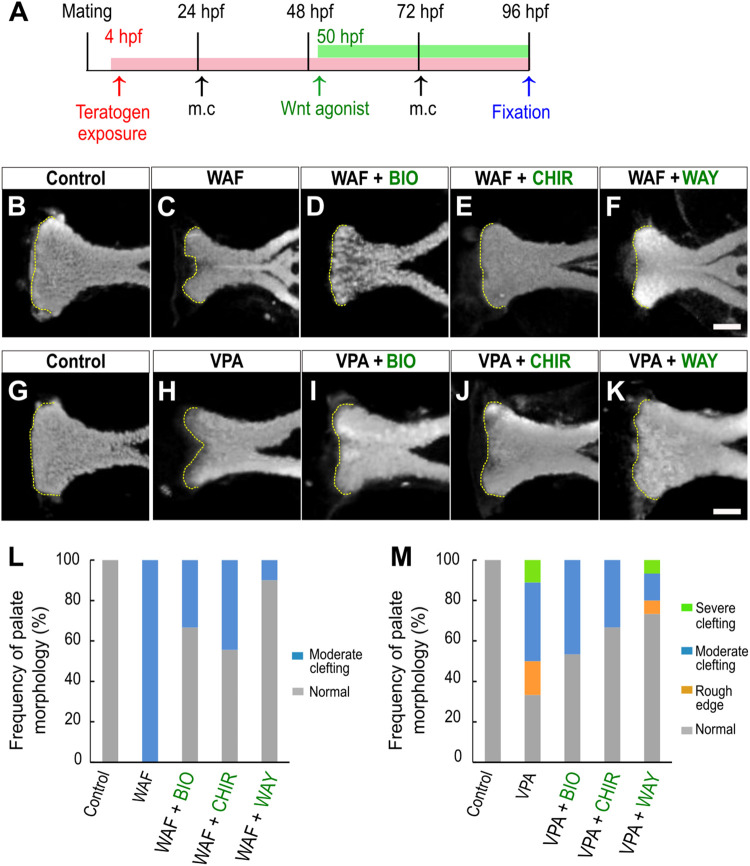
Image
Figure Caption

FIGURE 4

Restoration of chemical-induced cleft palate by Wnt agonists. (A) Experimental time course. m.c.: medium change. (B–K) Fluorescence images of the palate at 96 hpf. (B,C) WAF (30 μM) exposure induced cleft palate. (D–F) The cleft palate was rescued by combinatorial treatment with BIO (100 nM), CHIR99021 (300 nM) or WAY-262611 (250 nM). (G,H) VPA (20 μM) exposure induced cleft palate. (I–K) The cleft palate caused by VPA was rescued by combinatorial treatment with BIO (100 nM), CHIR99021 (300 nM) or WAY-262611 (250 nM). White indicates nuclei stained with DAPI. Yellow dotted lines trace the shape of the anterior edge of the plate. (L,M) Frequency of rescued cleft palate. n = 18 (Control), 11 (WAF), 12 (WAF + BIO), 9 (WAF + CHIR), 10 (WAF + WAY) in (L), n = 19 (Control), 18 (VPA), 15 (VPA + BIO), 18 (VPA + CHIR),15 (VPA + WAY) in (M). Scale bar: 50 μm.

Acknowledgments
This image is the copyrighted work of the attributed author or publisher, and ZFIN has permission only to display this image to its users. Additional permissions should be obtained from the applicable author or publisher of the image. Full text @ Front Cell Dev Biol