
|
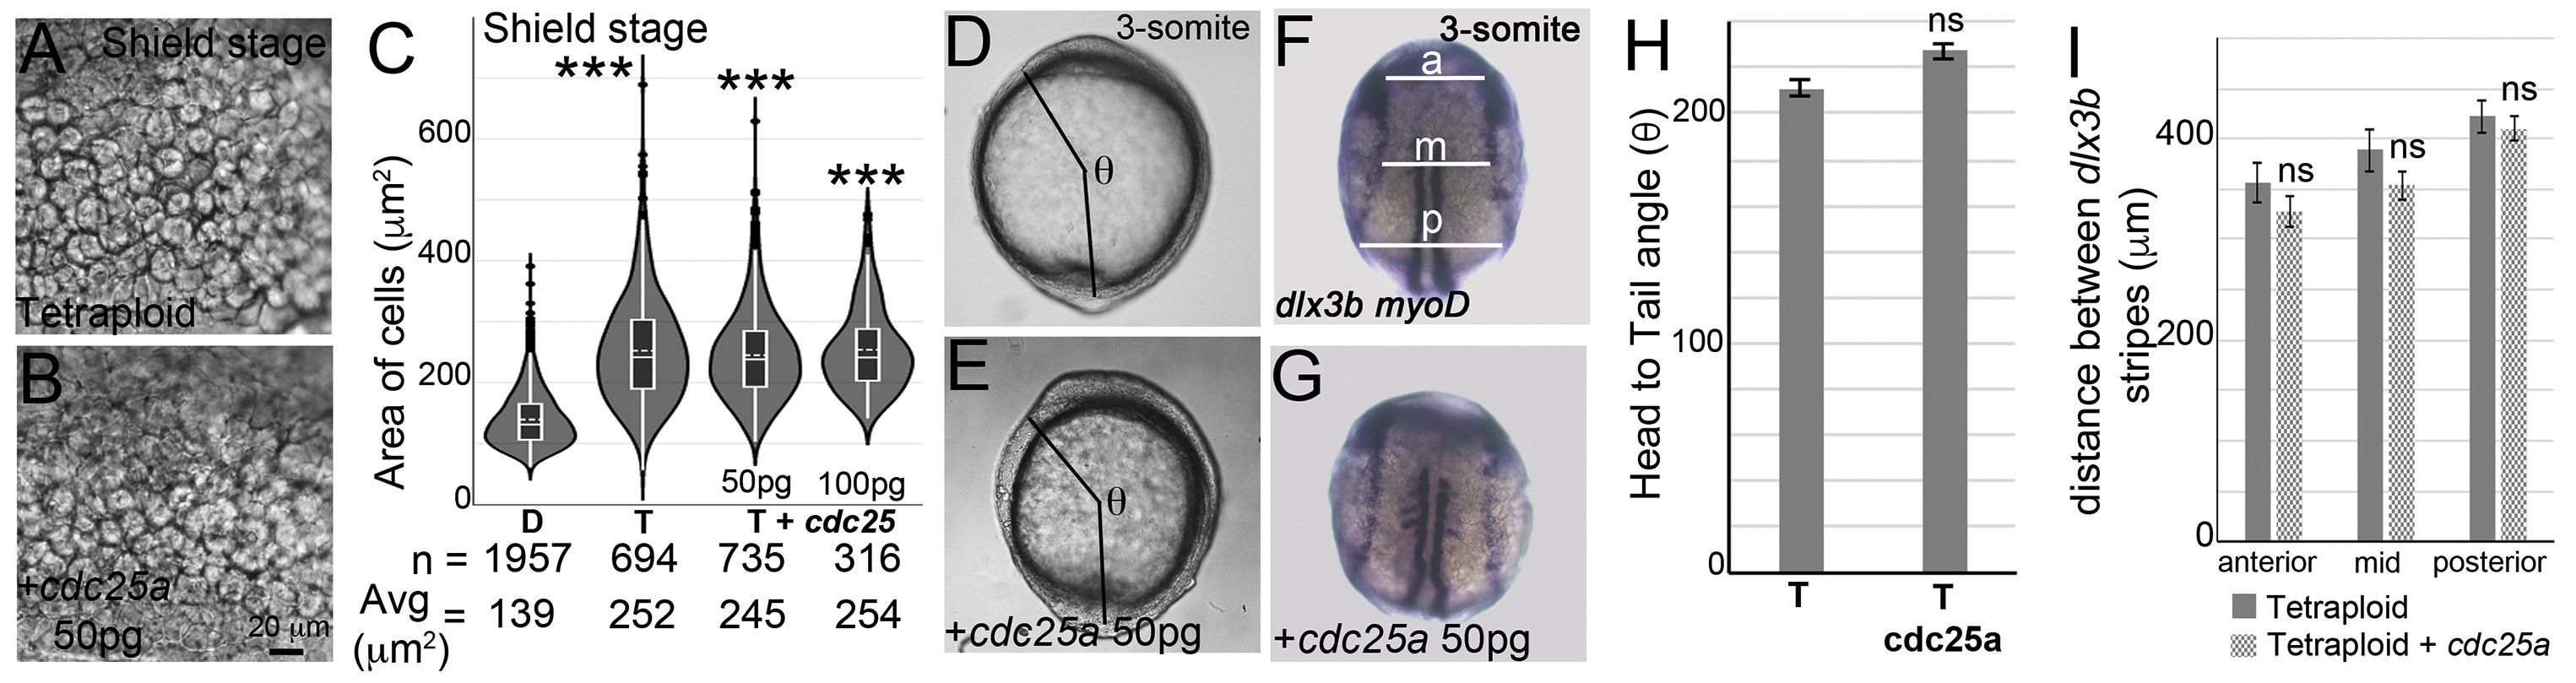
Fig. 6 Overexpression of cdc25a does not reduce cell areas in tetraploidsUninjected tetraploids (A, D, F) and tetraploids injected with 50 pg of cdc25a mRNA (B, E, G). At shield stages, cell sizes in cdc25a injected tetraploid embryos (B) resemble uninjected tetraploid embryos (A). Cell area distributions, dotted horizontal line within box plots indicate mean value, n = number of correctly segmented cells that were used for area calculations from 3 embryos (C). Asterisks denote statistical significance based on Mann Whitney (p ≤ 0.05) compared to normal diploid embryos (C). Body axis elongation in cdc25a injected tetraploids resemble uninjected tetraploids at end of gastrulation (D, n = 28/28, E, n = 30/32 H), quantified as the head to tail angle (θ, D, E) quantification of θ (H). RNA in situs for dlx3b and myoD (blue) in uninjected tetraploids (F, n = 28/33) and cdc25a injected tetraploids (G, n = 24/29), show failure to converge dorsally. Quantification of the distance between dlx3b stripes along the AP axis at three sites anterior (a), mid (m) and posterior (p) as shown in F (I). Asterisks denote statistical significance based on unpaired t-test and One-way ANOVA (p ≤ 0.05), error bars represent Standard Error of Mean (SEM) for H and I.
Reprinted from Developmental Biology, 468(1-2), Menon, T., Borbora, A.S., Kumar, R., Nair, S., Dynamic optima in cell sizes during early development enable normal gastrulation in zebrafish embryos, 26-40, Copyright (2020) with permission from Elsevier. Full text @ Dev. Biol.