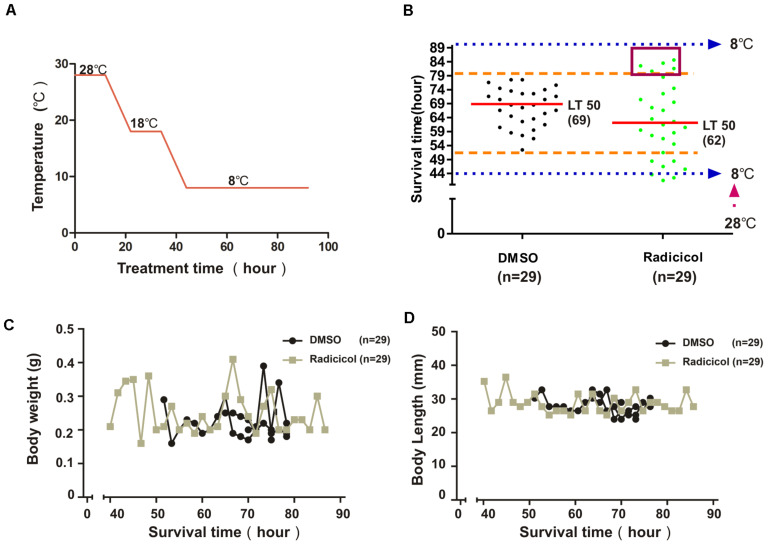
Impact of embryonic HSP90 inhibition on cold tolerance of zebrafish. (A) Schematic diagram of the cooling time course. The temperature decreased from 28 to 18°C at a rate of 1°C/h, remained at 18°C for 12 h (overnight), then decreased at a rate of 1°C/h until reaching a final temperature of 8°C. (B) Zebrafish from control and radicicol group were exposed to a temperature of 8°C according to the protocol in (A), then survival time and the median lethal time (LT50) were measured. Dotted blue line (bottom) indicates the starting time at 8°C. Broken orange lines indicate the range of survival time of zebrafish of control group. Red box indicates zebrafish with increased survival time (cold tolerant zebrafish). (C,D) Body weight and length of fishes with different survival time for both groups.
Acknowledgments
This image is the copyrighted work of the attributed author or publisher, and
ZFIN has permission only to display this image to its users.
Additional permissions should be obtained from the applicable author or publisher of the image.
Full text @ Front Genet
Your Input Welcome
Thank you for submitting comments. Your input has been emailed to ZFIN curators who may contact you if
additional information is required.
Oops. Something went wrong. Please try again later.