
Figure 5—figure supplement 1—source data 1.
- ID
- ZDB-IMAGE-201216-36
- Publication
- Rogers et al., 2020 - Optogenetic investigation of BMP target gene expression diversity
- All Figures
- Figures for Rogers et al., 2020
|
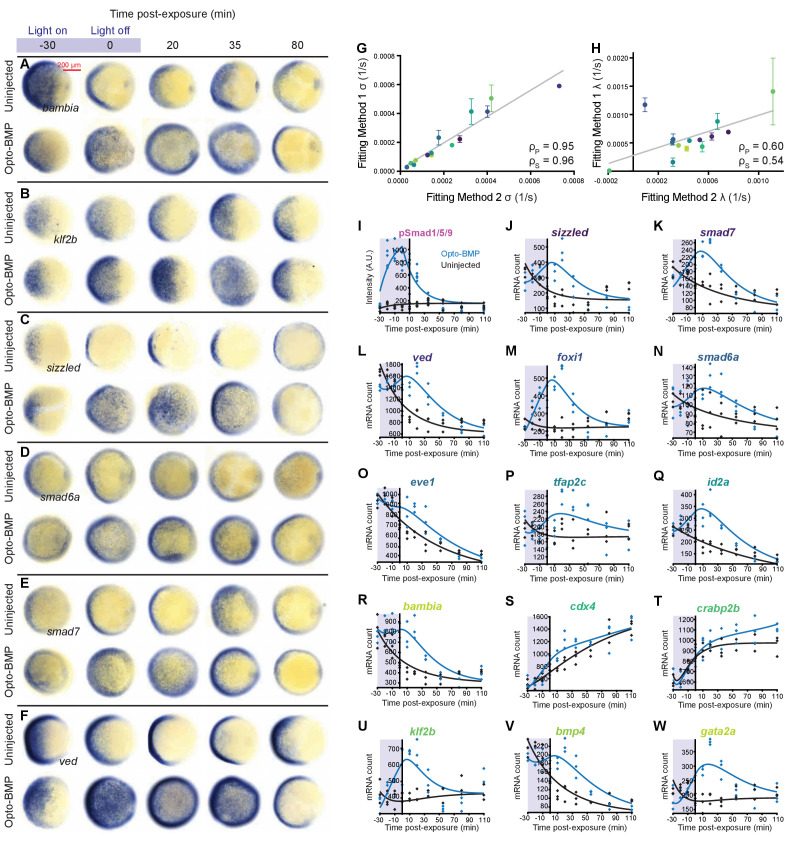
Figure 5—figure supplement 1—source data 1. (A–F) Opto-BMP and uninjected embryos were exposed to blue light (2300 lux) for 30 min at shield stage (~6.75 hpf), and BMP target gene expression was assessed using colorimetric in situ hybridization in response to the BMP signaling pulse (Figure 3C and Figure 3—figure supplement 1J). Animal pole views. (G-H) Transcript levels in embryos treated as described in A-F were quantified using NanoString technology (Figure 4). BMP target gene induction (σ) and decay constants (λ) were determined by fitting the data using two approaches (Materials and methods): In Method 1 (main text and Figure 5), individual Opto-BMP – uninjected subtracted data series were fitted with a model of induction and decay for each transcript; in Method 2, all raw data points from the Opto-BMP and uninjected data sets were fitted simultaneously for each transcript. Both approaches produced similar σ (G) and λ (H) values (gray lines represent linear fits, ρs = Spearman correlation coefficient, ρp = Pearson correlation coefficient, Method one median shown). (I-W) In Method 2, pSmad1/5/9 immunofluorescence (Figure 3C and Figure 3—figure supplement 1J) was fitted with a model of induction and decay (gray line, I) and used as signaling input to model the transcript time series. Fits of uninjected (black) and Opto-BMP (blue) transcript data using Method two are shown in J-W. See the Figure 5—figure supplement 1—source data 1 file for source data.