IMAGE

Fig. 2

ID
ZDB-IMAGE-201209-24
Source
Figures for Høgset et al., 2020
Image
Figure Caption

Fig. 2 Volumetric confocal Raman spectroscopic imaging of whole zebrafish embryos.

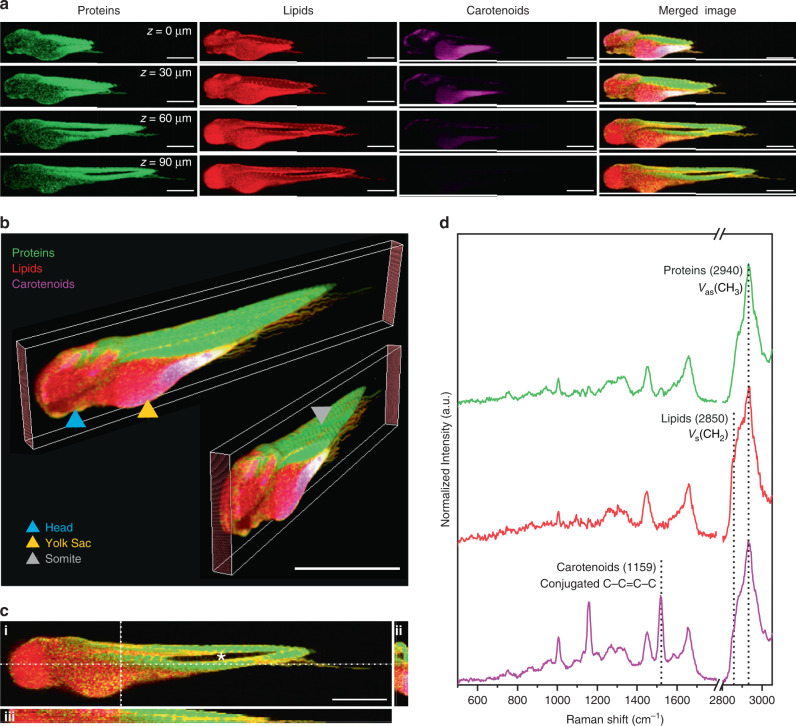
Confocal Raman spectroscopic imaging (cRSI) was used to image a fixed embryo (N = 1) at 3 days post fertilization at 10 μm in-plane resolution and 10 μm out-of-plane resolution. a Single images collected at different confocal planes with normalized univariate peak intensity (a full dataset with all confocal planes is shown in Supplementary Fig. 1). The Z-position relative to the top slice of the stack is indicated. Scale bars: 500 μm. b These individual confocal planes were reconstructed into a multichannel 3D stack with 10 x 10 x 10 µm3 voxel resolution, enabling whole-embryo visualization at different angles. The blue triangle indicates the head, the orange triangle indicates the yolk sac, and the grey triangle indicates a somite. Scale bar: 1 mm. c Z-projections were also generated enabling cross-sectional visualization of (i) the sagittal plane, (ii) the frontal plane and (iii) the transverse plane. The asterisk in the sagittal plane denotes the hollow notochord, which can also be visualized as a cross-section in the transverse plane images. Scale bar: 500 µm. d Representative spectra collected from volumetric cRSI performed on whole zebrafish embryos. The annotated peak centers used for univariate analysis are indicated by dotted lines. Univariate analysis was performed by integrating over a wavenumber range corresponding to relevant biomolecules: protein-rich regions at 2940 ± 16 cm−1 (shown in green), lipid-rich regions at 2850 ± 5 cm−1 (shown in red), carotenoid-rich regions at 1159 ± 16 cm−1 (shown in magenta).

Acknowledgments
This image is the copyrighted work of the attributed author or publisher, and ZFIN has permission only to display this image to its users. Additional permissions should be obtained from the applicable author or publisher of the image. Full text @ Nat. Commun.