
|
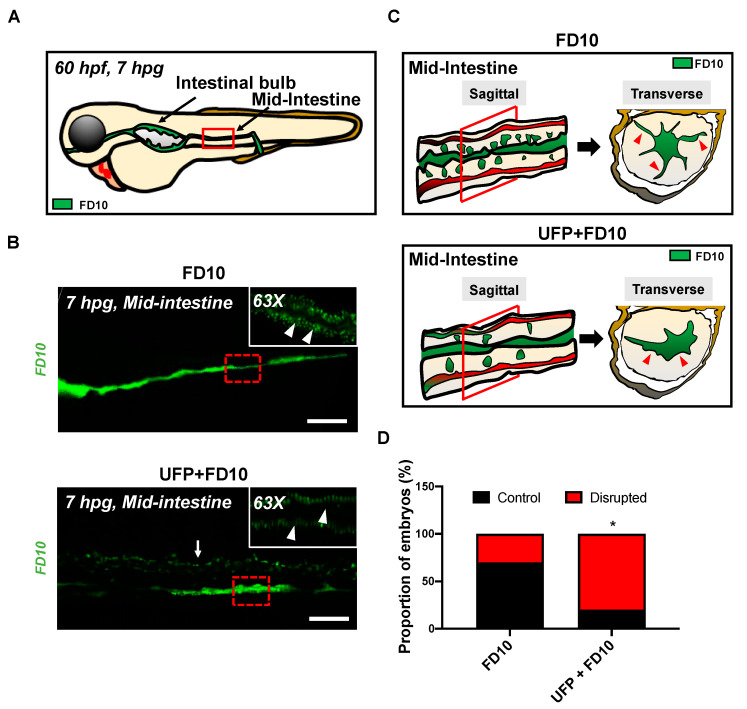
Figure 2
Acute UFP exposure disrupts maturation of embryonic GI tract. (A) Schematic representation of the embryonic GI tract at 7 hpg. The density of FD10 fluorescence in the mid-intestine was assessed to evaluate maturation of the GI tract (Red box). (B) Representative images of UFP-disrupted GI tract (white dashed box). Compared to FD10-gavaged controls, co-gavaging UFP, as denoted with endoluminal FD10 fluorescence (white arrow), altered morphology and systemically reduced the density of FD10 fluorescence in the mid-intestine (white arrowheads, n = 5 per group). Scale bar: 20 μm. (C) Schematic representations of sagittal and transverse views of the mid-intestine with and without UFP gavage. Acute UFP exposure in developing GI system retards maturation (red arrowheads). (D) Percentage of embryos exhibiting reduced FD10 density in the mid intestine (* p < 0.05 vs. FD10, n = 10 per group).