
Figure 3
- ID
- ZDB-IMAGE-201130-75
- Genes
- Publication
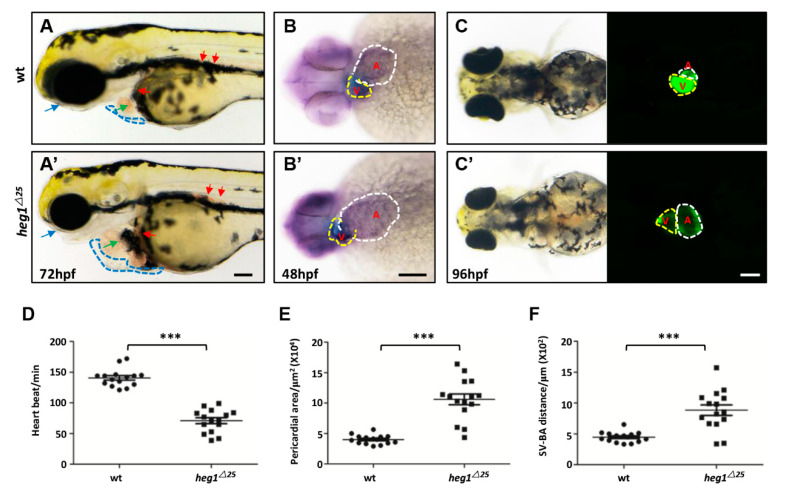
- Lu et al., 2020 - Generation and Application of the Zebrafish heg1 Mutant as a Cardiovascular Disease Model
- All Figures
- Figures for Lu et al., 2020
|
Figure 3