
Image
|
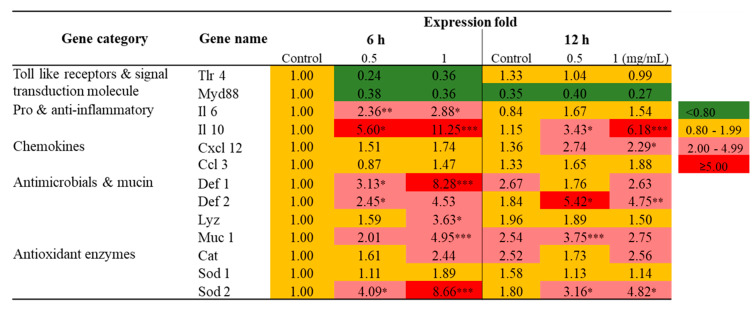
Figure Caption
Figure 1
Transcriptional profiling of immune related genes in Raw 264.7 cells exposed to SmPNPs (0.5 and 1 mg/mL) for 6 and 12 h. Data are expressed as means plus or minus standard deviation (± SD) of triplicate samples. Asterisk (*) marks indicate statistical significance compared to SmPNPs treated vs. untreated control (One-way ANOVA *
Acknowledgments
This image is the copyrighted work of the attributed author or publisher, and
ZFIN has permission only to display this image to its users.
Additional permissions should be obtained from the applicable author or publisher of the image.
Full text @ Mar. Drugs