
Figure 2
- ID
- ZDB-IMAGE-201130-36
- Publication
- Lai et al., 2020 - Duplicated dnmt3aa and dnmt3ab DNA Methyltransferase Genes Play Essential and Non-Overlapped Functions on Modulating Behavioral Control in Zebrafish
- All Figures
- Figures for Lai et al., 2020
|
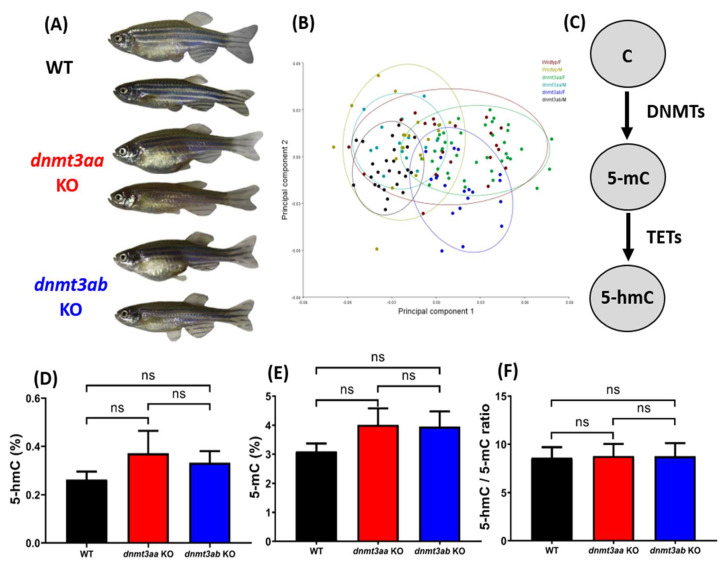
Figure 2
Morphometric and DNA methylation level comparison for wild types,