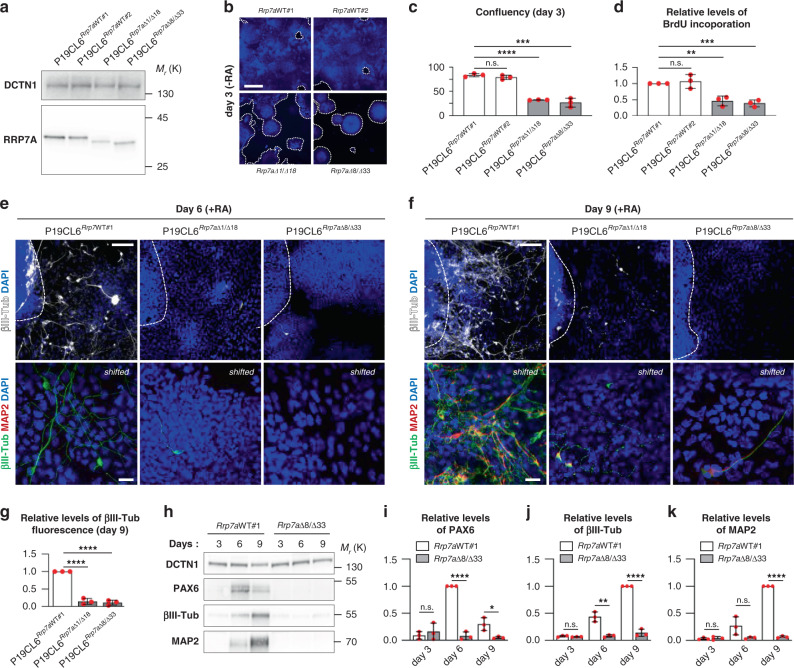
a WB analysis of RRP7A expression in CRISPR clones of P19CL6 mouse stem cells holding WT RRP7A (P19CL6Rrp7aWT#1 and P19CL6Rrp7aWT#2) or mutated RRP7A; P19CL6Rrp7aΔ1/Δ18 (pArg59LysfsTer60/p.53-58del) and P19CL6Rrp7aΔ8/Δ33 (p.Arg48ProfsTer15/p.49-59del). b IFM analysis of CRISPR clone proliferation at day 3 post seeding in the absence of retinoic acid (RA). Nuclei were stained with DAPI (blue). Dotted lines outline cell colonies. Scale bars, 1 mm. c Quantification of proliferation of CRISPR clones measured by cell coverage (confluency) (data average of n = 3 independent experiments); Rrp7aWT#2 (P = 0.230), Rrp7aΔ1/Δ18 (P = 1.268E-05), Rrp7aΔ8/Δ33 (P = 5.372E-04)). d Quantification of relative levels of BrdU incorporation in WT and mutant clones (data average of n = 3 independent experiments; Rrp7aWT#2 (P = 0.617), Rrp7aΔ1/Δ18 (P = 0.004), Rrp7aΔ8/Δ33 (P = 5.635E-04)). e, f IFM analysis of the ability of CRISPR clones to undergo neurogenesis after 6 d and 9 e days of RA stimulation. The stippled lines in the upper panels indicate the lining of cellular clusters from where neurons are formed in WT clones. Neurons are marked with anti-ßIII-tubulin (upper panels: white; lower panels: green) and anti-MAP2 (lower panels: red), and nuclei are stained with DAPI (blue). Lower panels are shown as shifted overlays between ßIII-tubulin and MAP2. Scale bar upper panels, 0.1 mm and lower panels, 40 µm. g Quantification of relative levels of βIII-tubulin fluorescence in WT and mutant clones shown in f (data average of n = 3 independent experiments; Rrp7aΔ1/Δ18 (P = 6.244E-05), Rrp7aΔ8/Δ33 (P = 2.479E-04)). h WB analysis of WT clone P19CL6Rrp7aWT#1 and mutant clone P19CL6Rrp7aΔ8/Δ33 at day 3, 6, and 9 of RA stimulation; antibodies as indicated. i–k Quantification of relative levels of PAX6 (day 3: P = 0.532; day 6: P = 2.696E-05; day 9: P = 0.025) (i), ßIII-tubulin (day 3: P = 0.232; day 6: P = 0.003; day 9: P = 2.400E-05) (j) and MAP2 (day 3: P = 0.774; day 6: P = 0.085; day 9: P = 1.117E-07) k shown in h (data average of n = 3 independent experiments). Data are represented as mean ± SD and significance was determined using an unpaired, two-tailed Student’s t test. *P < 0.05, **P < 0.01, ***P < 0.001, ****P < 0.0001, n.s.: not significant.
Acknowledgments
This image is the copyrighted work of the attributed author or publisher, and
ZFIN has permission only to display this image to its users.
Additional permissions should be obtained from the applicable author or publisher of the image.
Full text @ Nat. Commun.
Your Input Welcome
Thank you for submitting comments. Your input has been emailed to ZFIN curators who may contact you if
additional information is required.
Oops. Something went wrong. Please try again later.