IMAGE

Figure 4

ID
ZDB-IMAGE-201121-134
Source
Figures for Abdul Satar et al., 2020
Image
Figure Caption

Figure 4

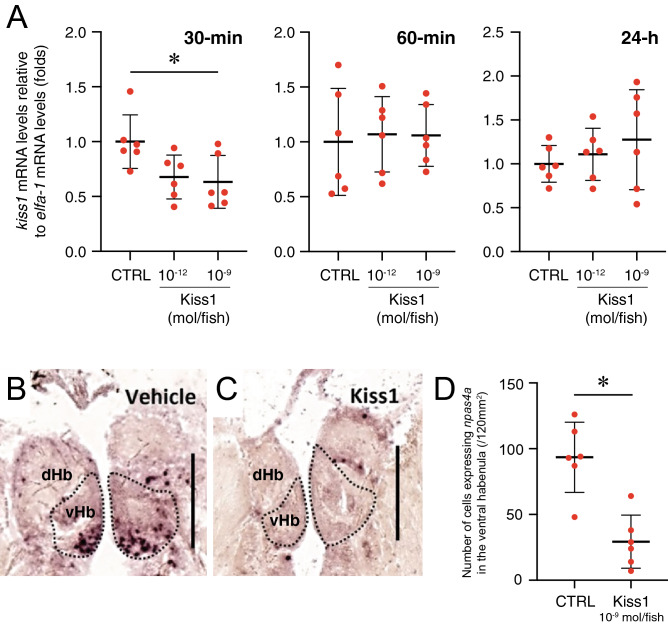
Effect of Kiss1 on the habenula activity. (A) Central administration of Kiss1 (10–9 mol/fish) significantly suppressed expression of kiss1 mRNA levels (against the eef1a1l1 in fold-change ± SD, n = 6 fish/ group) 30-min, but not 1-h and 24-h after administration. (B,C) Expression of npas4a in the vHb 30-min after the administration of vehicle (control, B) or Kiss1 (10–9 mol/fish, C). Scale bars 100 µm. (D) Number of cells expressing npas4a in the habenula were significantly lower as compared to control fish. *P < 0.05 vs. controls using one-way ANOVA followed by Dunnett’s multiple comparison test (kiss1) or unpaired t-test (npas4a).

Acknowledgments
This image is the copyrighted work of the attributed author or publisher, and ZFIN has permission only to display this image to its users. Additional permissions should be obtained from the applicable author or publisher of the image. Full text @ Sci. Rep.