IMAGE

Figure 3

ID
ZDB-IMAGE-201121-133
Source
Figures for Abdul Satar et al., 2020
Image
Figure Caption

Figure 3

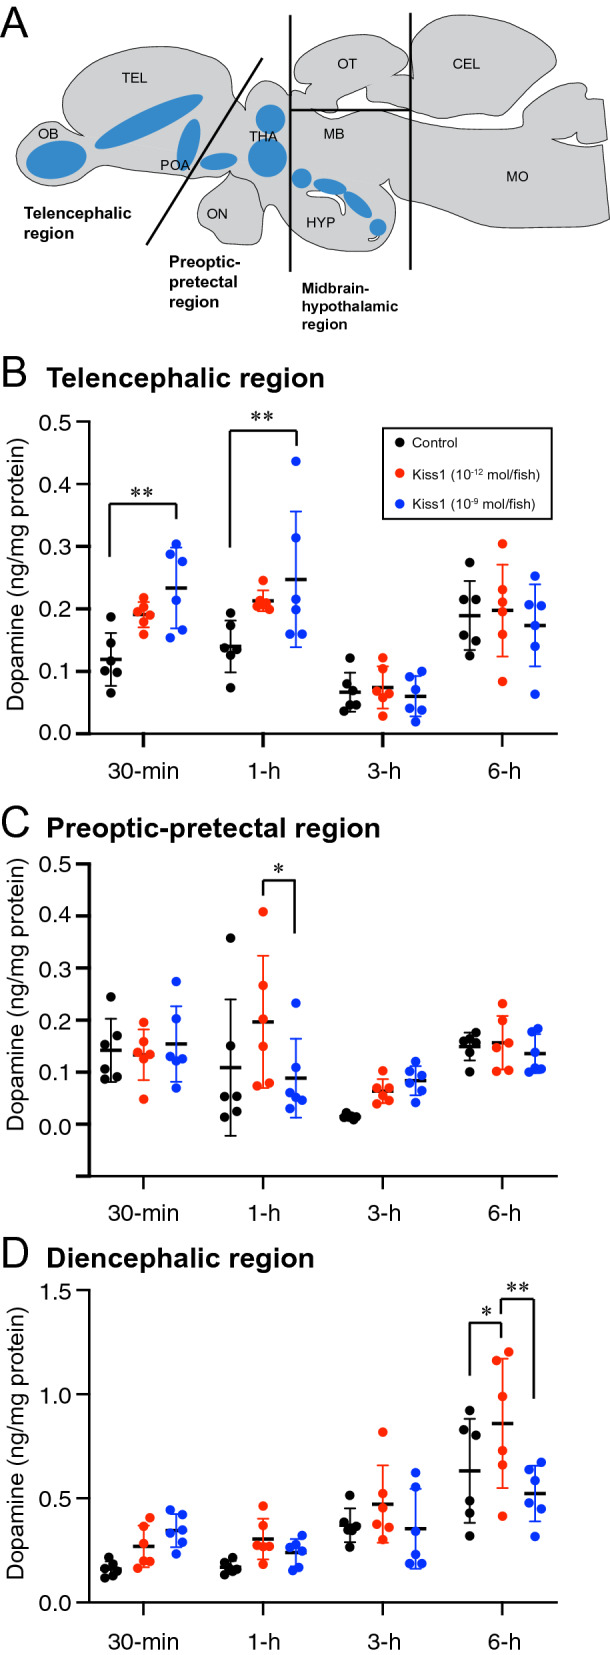
Effect of Kiss1 on dopamine levels in different brain regions. (A) Schematic sagittal view of a zebrafish brain illustrating the macro-dissected brain regions that were subjected to analyses of dopamine content levels and the distribution of dopaminergic cell populations (blue-shaded zones). (BD) Dopamine content levels (ng per mg protein; n = 6 fish/group) in macro-dissected telencephalon (B), preoptic-pretectal (C) and midbrain-hypothalamic (D) regions, 30-min, 1-h, 3-h and 6-h after central administration of either vehicle (control; distilled water) or Kiss1 with doses of 10–12 or 10–9 mol/ fish. Data presented as mean ± SD. *P < 0.05; **P < 0.01 using 2-way ANOVA followed by Tukey’s multiple comparison test.

Acknowledgments
This image is the copyrighted work of the attributed author or publisher, and ZFIN has permission only to display this image to its users. Additional permissions should be obtained from the applicable author or publisher of the image. Full text @ Sci. Rep.