IMAGE

Figure 2

ID
ZDB-IMAGE-201121-132
Source
Figures for Abdul Satar et al., 2020
Image
Figure Caption

Figure 2

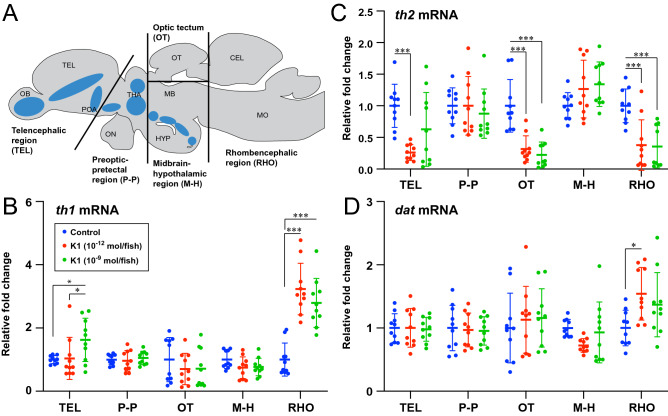
Effect of Kiss1 on the expression of dopamine-related genes in different brain regions. (A) Schematic sagittal view of a zebrafish brain illustrating the macro-dissected brain regions that were subjected to analyses of gene-expression levels. Blue-shaded regions indicate the distribution of dopaminergic cell populations. (BD) Relative expression (fold-change) of th1 (B), th2 (C) and dat (D) mRNAs (n = 10 fish/group) in macro-dissected brain regions 24-h after central administration of either vehicle (control; distilled water) or Kiss1 (K1) with doses of 10–12 or 10–9 mol/ fish. Data presented as mean ± SD. *P < 0.05; ***P < 0.0001 using two-way ANOVA, Tukey's multiple comparisons test.

Acknowledgments
This image is the copyrighted work of the attributed author or publisher, and ZFIN has permission only to display this image to its users. Additional permissions should be obtained from the applicable author or publisher of the image. Full text @ Sci. Rep.