
Figure 5
- ID
- ZDB-IMAGE-201012-74
- Publication
- Inaba et al., 2020 - Keratins and Plakin family cytolinker proteins control the length of epithelial microridge protrusions
- All Figures
- Figures for Inaba et al., 2020
|
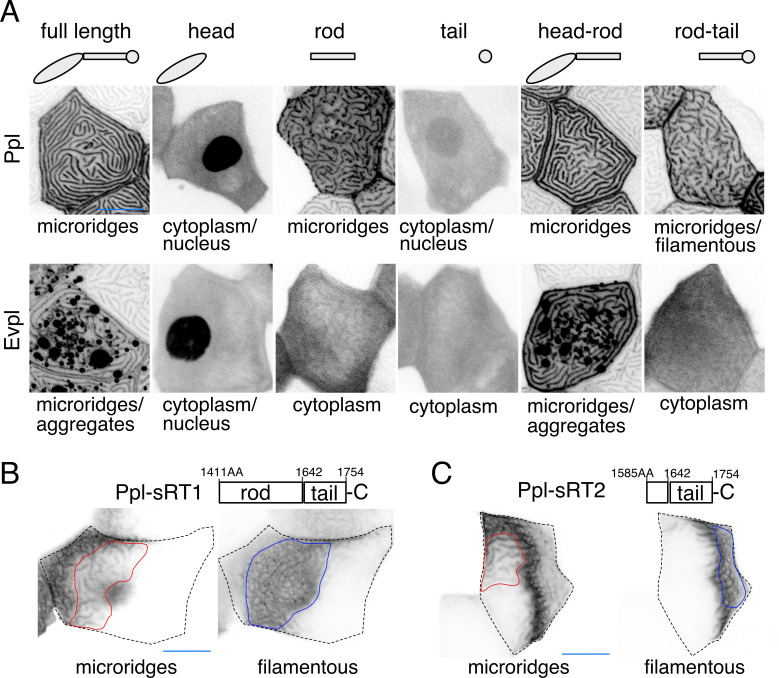
Figure 5 (A) Periderm cells expressing Evpl-tdTomato and Ppl-GFP variants at 48hpf. Schematics indicate the domains in each variant. (B–C) Optical sections of GFP-tagged Ppl truncated rod-tail fusions expressed in periderm cells at 48hpf. Sections highlight the microridge-like pattern at the apical surface of cells (left, red outlines) or the filamentous pattern deeper in cells (right, blue outlines). Top: Diagram of Ppl protein domains. Amino acid numbers are indicated. See Figure 5—video 1 for video showing apical-to-basal sections of these images. Images were inverted so that high-intensity fluorescence appears black and low-intensity fluorescence is white. Scale bars: 10 µm.