Image
Figure Caption

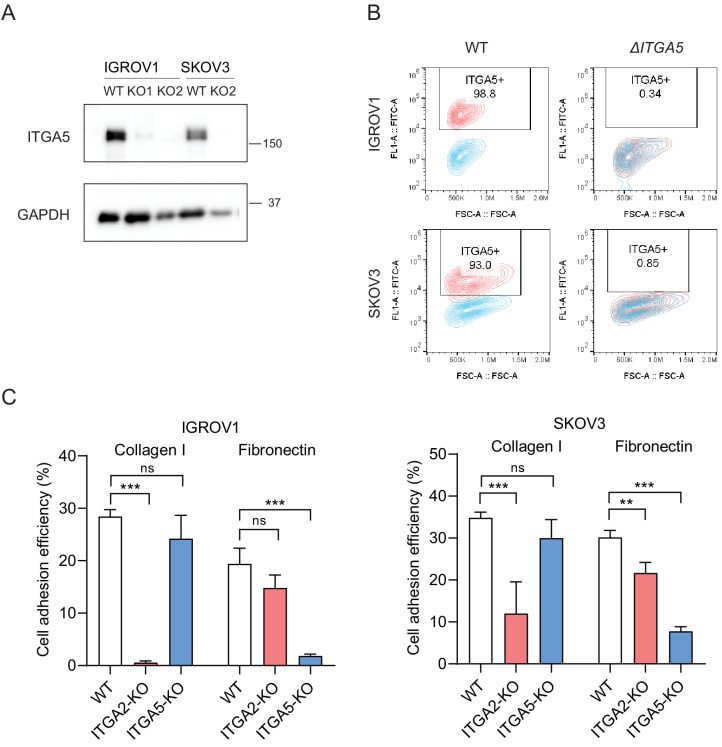
Figure 5—figure supplement 2. Establishment and characterization of <italic>ITGA5</italic> knockout ovarian cancer cell lines.

(A) Immunoblot confirmed loss of ITGA5 expression in IGROV1 and SKOV3 ΔITGA5 (KO) cell lines. (B) Representative flow cytometry analysis of ΔITGA5 cells stained with primary anti-human ITGA5 antibody and goat anti-mouse-FITC secondary antibody. (C) Cell-ECM adhesion assay of WT, ΔITGA2, and ΔITGA5 cancer cells. Bar chart summarizes percentage of cell-ECM adhesion efficiency from two independent experiments (***p<0.001, unpaired Student’s t-test).

Acknowledgments
This image is the copyrighted work of the attributed author or publisher, and ZFIN has permission only to display this image to its users. Additional permissions should be obtained from the applicable author or publisher of the image. Full text @ Elife