
|
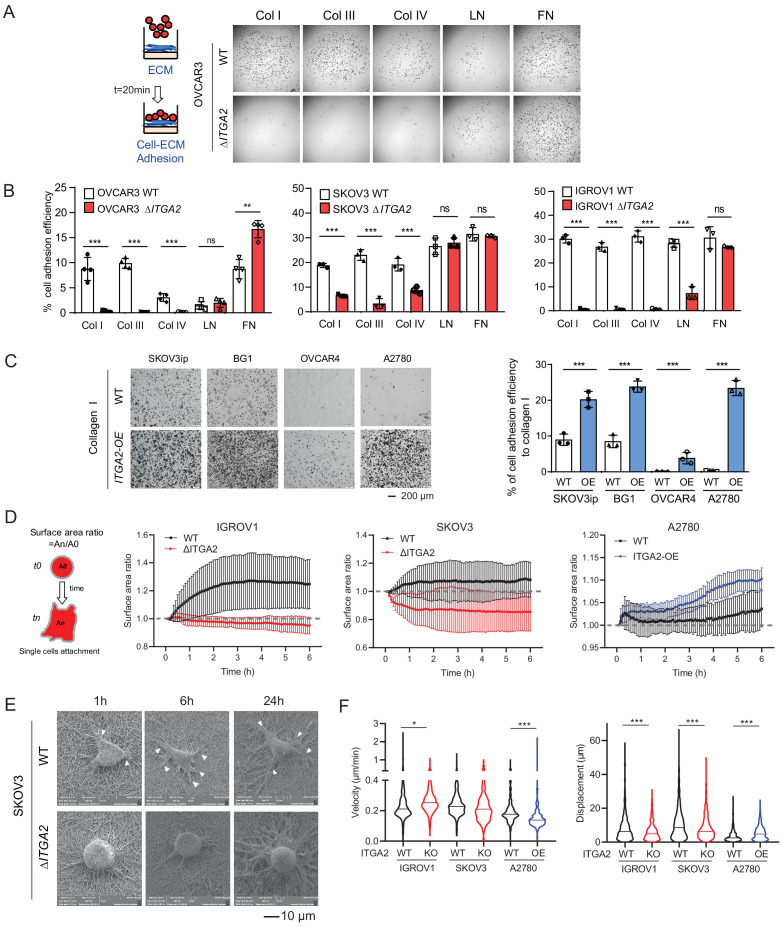
Figure 4 (A) Static cancer cell-ECM adhesion assay. Representative images showing OVCAR3 WT and ΔITGA2 cell adhesion to different ECM proteins, including collagen type I, III, IV, laminin, and fibronectin. (B) Bar charts with mean ± SD of the percentage of cell adhesion efficiency of OVCAR3, SKOV3, and IGORV1 cells from three independent experiments. (unpaired Student’s t-test, ***p<0.001) (C) Representative images and bar charts showing the cell adhesion to collagen I in four ITGA2-overexpressed EOC cell lines (unpaired Student’s t-test, ***p<0.001). Scale bar 200 μm. (D) Single cell adhesion on bioprinted collagen was monitored by time-lapse microscopy. Data represent the surface area ratio as mean ± SD (n > 300 single cells were analyzed per group). (E) Representative scanning electron microscope (SEM) images showing the SKOV3 WT and ΔITGA2 cellular adherence on bioprinted collagen at 1, 6, and 24 hr. White arrow indicates the polarized filopodia structure. Scale bar 10 μm. (F) Velocity and displacement of single cells on collagen-coated slides were measured (n > 300 per group from three independent experiments. Unpaired Student’s t-test, *p<0.05, ***p<0.001).