
|
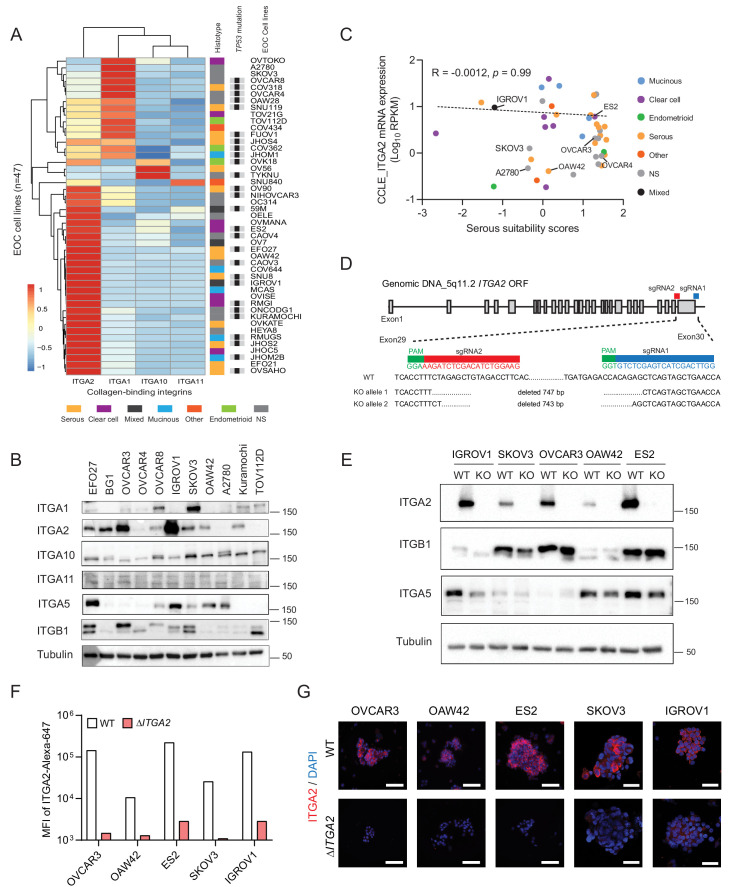
Figure 2 (A) Hierarchical cluster analysis and heat map visualization of known collagen-binding integrin-encoding genes among EOC cell lines using the Cancer Cell Line Encyclopedia (CCLE). The original histological subtypes and TP53 genomic mutation status were annotated as previously described (Domcke et al., 2013). (B) Representative western blot showing expression of collagen-binding integrins among eleven EOC cell lines. (C) ITGA2 expression (Spearman correlation R = −0.0012, p=0.99) is independent of histological subtypes and previously described serous suitability scores (Domcke et al., 2013). Representative EOC cell lines used in this study are annotated. (D) CRISPR-Cas9 mediated deletion of ITGA2 targeting exon 29–30, resulting in a 743 and 747 bp genomic deletion. (E) Immunoblot confirms loss of ITGA2 expression in five of ΔITGA2 (KO) cell lines while the binding partner ITGB1 was not altered. (F) Bar chart showed the median fluorescence intensity of ITGA2 expression in WT and ΔITGA2 cells by flow cytometry. (G) Representative fluorescence images with membranous ITGA2 expression in WT and ΔITGA2 cancer spheroids collected from ultra-low attachment plate. Scale bar 100 μm.