IMAGE

Figure 3

ID
ZDB-IMAGE-201003-33
Source
Figures for Converse et al., 2020
Image
Figure Caption

Figure 3

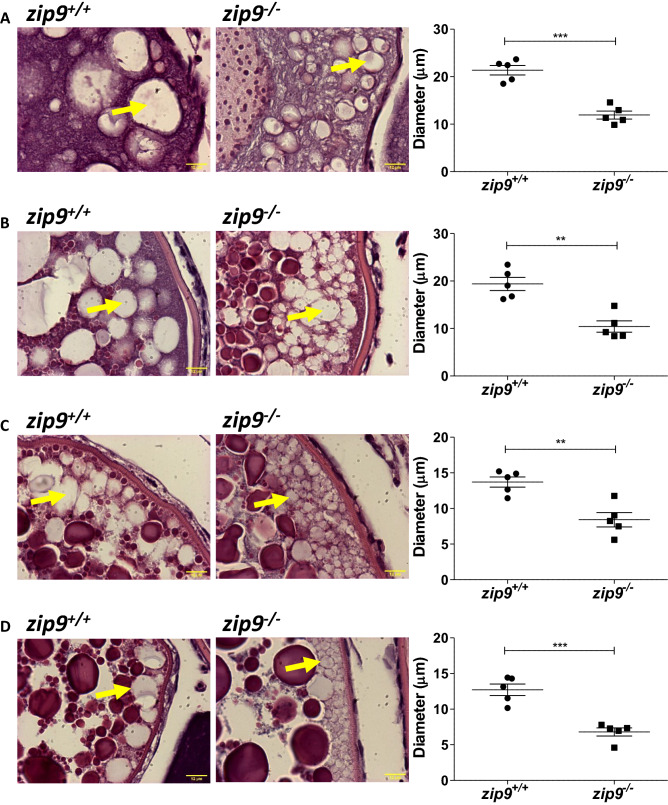
Morphology of cortical vesicles of zip9+/+ and zip9-/- oocytes throughout oogenesis. Representative images and average cortical vesicle diameters of (A) cortical alveoli, (B) early vitellogenic, (C) mid vitellogenic, and (D) late vitellogenic stage zip9+/+ and zip9-/- oocytes. Arrows indicate location of cortical vesicles. Scale bars: 12 µm. All data represents means ± SEM; n = 5 (average diameter of cortical vesicles for 5 females). Significance was determined by Welch's t-test (**, P < 0.01; ***, P < 0.001).

Figure Data
Acknowledgments
This image is the copyrighted work of the attributed author or publisher, and ZFIN has permission only to display this image to its users. Additional permissions should be obtained from the applicable author or publisher of the image. Full text @ Sci. Rep.