
Image
|
Figure Caption
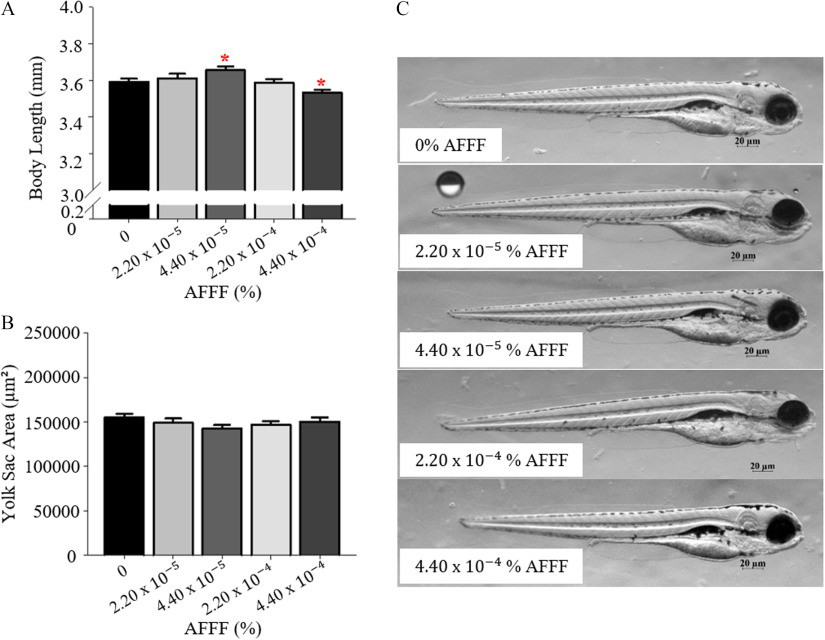
Figure 3.
Larval developmental measurements at 96 h post fertilization (hpf) with AFFF exposures. Larval body length (A) and yolk sac area (B) are graphed. (C) Representative images from
Acknowledgments
This image is the copyrighted work of the attributed author or publisher, and
ZFIN has permission only to display this image to its users.
Additional permissions should be obtained from the applicable author or publisher of the image.
Full text @ Environ. Health Perspect.