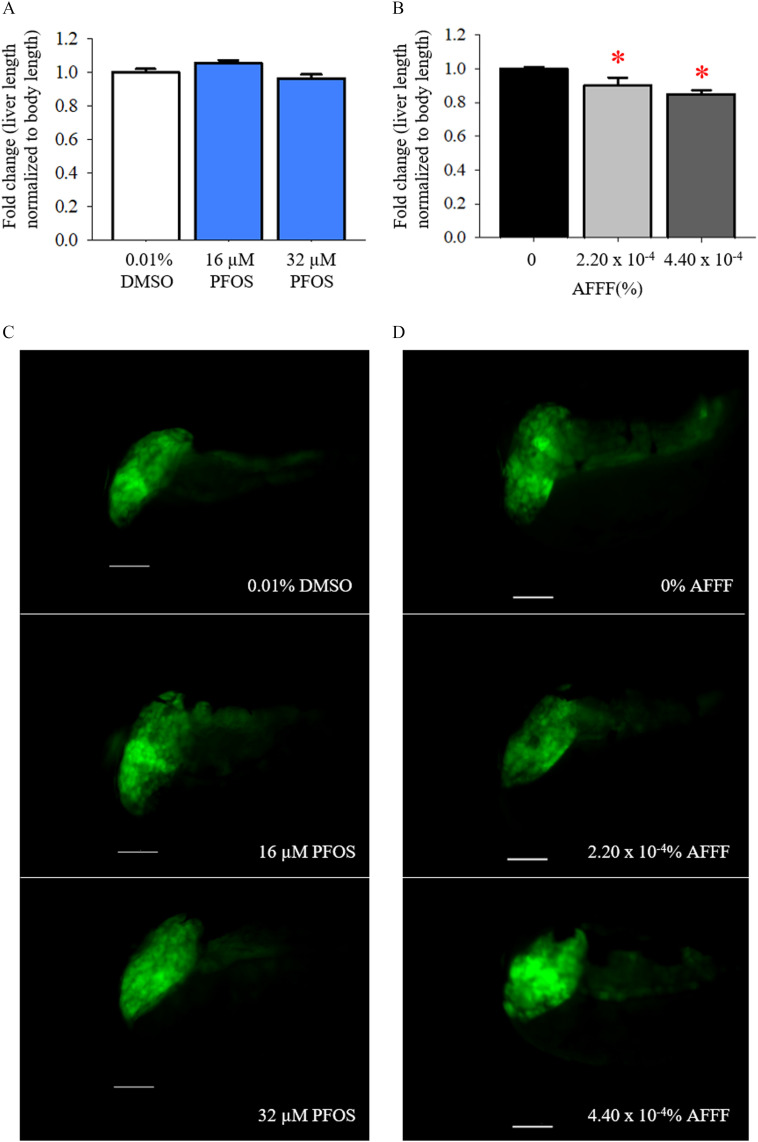
IMAGE

Figure 7.

ID
ZDB-IMAGE-201003-222
Source
Figures for Annunziato et al., 2020
Image
Figure Caption

Figure 7.

The impacts of liver elongation with developmental PFOS and AFFF exposures in 96 h post fertilization (hpf) larvae after developmental PFOS exposures, (A) liver length normalized to larval body length are graphed and (C) representative image are depicted. Scale bars represent 100μM in all images. Following developmental AFFF exposures, (B) liver length normalized to larval body length are graphed and (D) representative image are depicted. Bars represent mean±SEM. Asterisk (*) indicate p<0.05 compared with 0% AFFF, one-way ANOVA, Tukey’s HSD post hoc test. PFOS exposures: n=9 vials. AFFF exposures: n=56 vials. Note: AFFF, aqueous film-forming foam; ANOVA, analysis of variance; PFOS, perfluorooctanesulfonic acid.

Acknowledgments
This image is the copyrighted work of the attributed author or publisher, and ZFIN has permission only to display this image to its users. Additional permissions should be obtained from the applicable author or publisher of the image. Full text @ Environ. Health Perspect.