
Figure 4
- ID
- ZDB-IMAGE-201003-137
- Publication
- Weger et al., 2020 - MondoA regulates gene expression in cholesterol biosynthesis-associated pathways required for zebrafish epiboly
- All Figures
- Figures for Weger et al., 2020
|
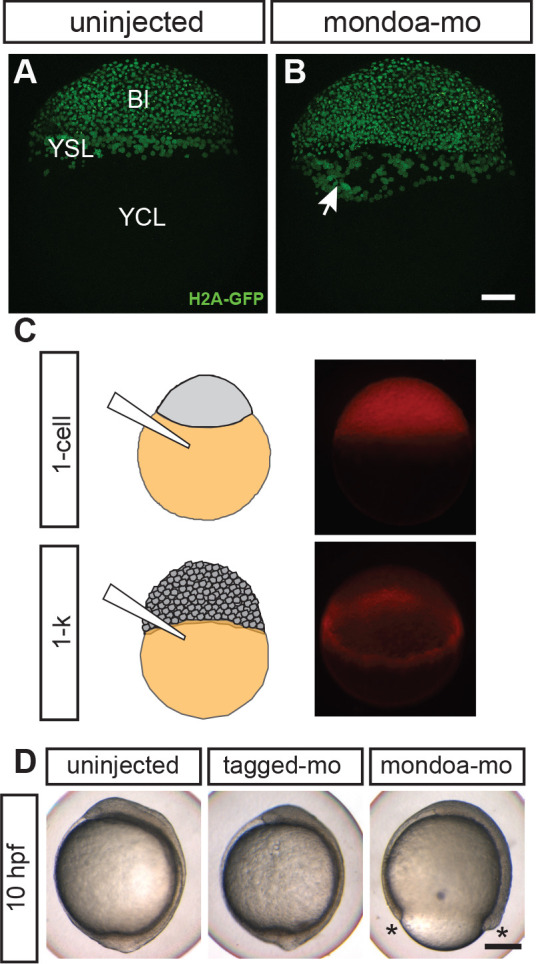
Figure 4 (A, B) Confocal images of Tg(h2afva:h2afva-GFP) embryos injected with mondoa-mo (B, n = 5) and uninjected controls (A, n = 5). Arrow: disordered YSL nuclei. YCL, yolk cytoplasmic layer, Bl, blastoderm. Scale bar: 100 µm. (C) Distribution of MOs upon injection at the zygote or 1 k-cell stages, as indicated in the schematic. Injection of mondoa-mo together with a lissamine-tagged fluorescent MO of unrelated sequence (tagged-mo) into the yolk of 1 cell stage eggs leads to fluorescence in the entire embryo, whereas injection of the MOs into the yolk cell of the 1 k-cell stage embryos limits fluorescence to the YSL. (D) Embryos injected at the 1 k-cell stage with the indicated MOs shown when the uninjected control (n = 29/29, 100%) was at bud stage. All mondoa-mo injected embryos were arrested in epiboly (~75% epiboly stage; n = 9/9, 100%), while embryos injected with tagged-mo alone were unaffected (n = 12/12, 100%). Scale bar: 0.2 mm. Asterisks label the blastoderm margin. hpf, hours post fertilization.