
Fig. 4
- ID
- ZDB-IMAGE-201003-130
- Publication
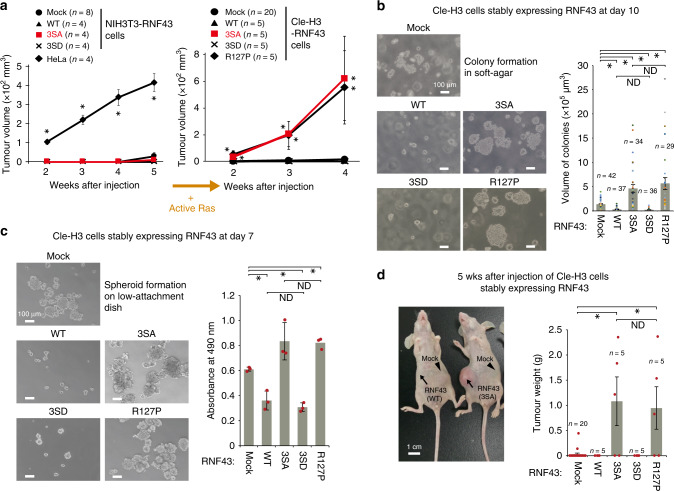
- Tsukiyama et al., 2020 - A phospho-switch controls RNF43-mediated degradation of Wnt receptors to suppress tumorigenesis
- All Figures
- Figures for Tsukiyama et al., 2020
|
Fig. 4