IMAGE

FIGURE 3

ID
ZDB-IMAGE-201003-12
Source
Figures for Steindal et al., 2020
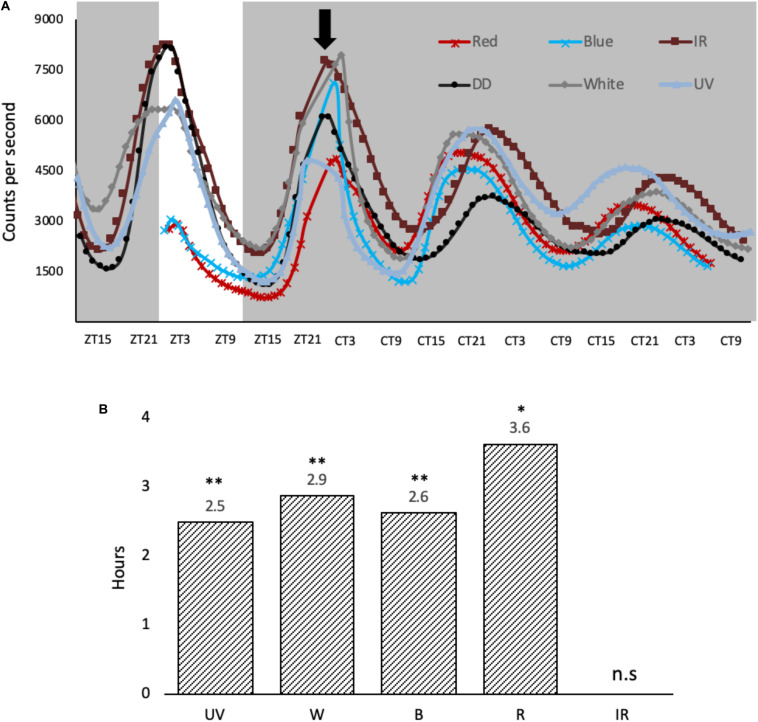
Image
Figure Caption

FIGURE 3

Light-induced phase shifts in response to monochromatic light-pulses in per1-luciferase zebrafish cells. (A) Cells were entrained for 3 days on a 12:12 LD cycle, before they were given a variety of monochromatic light pulses at ZT21, denoted by black arrow. The cells were kept in constant dark over two subsequent days. (B) Light pulses cause a phase advance in hours, determined at the half maximum between peak and trough vs. no LP controls. A two-way ANOVA (time, wavelength) was used to determine significant variation between samples. Amplitude and baseline were detrended using BioDare2 (Zielinski et al., 2014), and a Tukey post-test was used to determine significance in phase shift relative to DD control. p < 0.01 and ∗∗p < 0.001 (n = 8).

Acknowledgments
This image is the copyrighted work of the attributed author or publisher, and ZFIN has permission only to display this image to its users. Additional permissions should be obtained from the applicable author or publisher of the image. Full text @ Front. Physiol.