IMAGE

Fig. 3.

ID
ZDB-IMAGE-201003-119
Source
Figures for Hoeksma et al., 2020
Image
Figure Caption

Fig. 3.

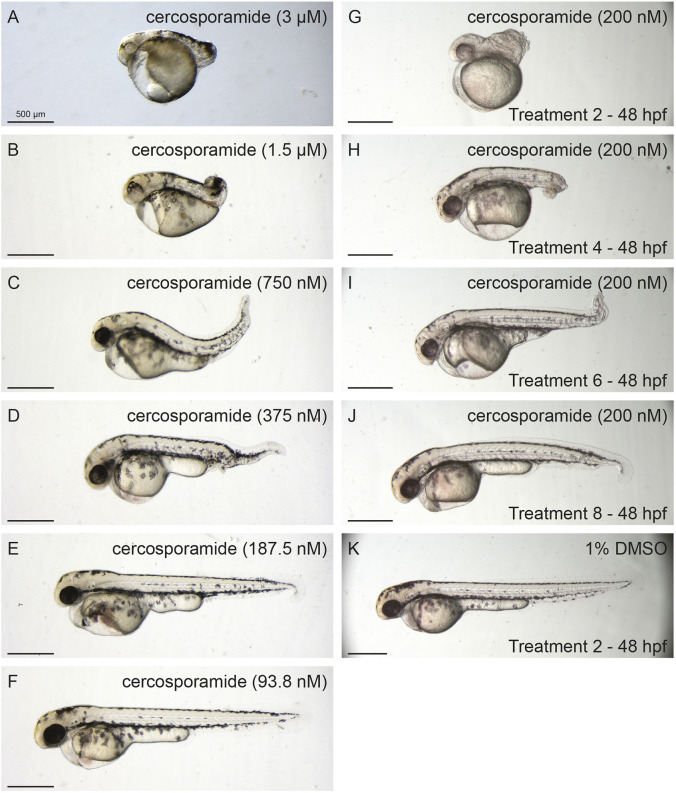
Dose- and time-dependent developmental defects of cercosporamide in zebrafish embryos. (A-F) Examples of phenotypes caused by a cercosporamide dilution range of 3 µM to 93 nM. (G-J) Examples of phenotypes caused by 200 nM cercosporamide with different treatment start times as indicated in hpf. (K) Control, 1% DMSO-treated embryo. Ten embryos were incubated per condition; representative pictures are shown.

Acknowledgments
This image is the copyrighted work of the attributed author or publisher, and ZFIN has permission only to display this image to its users. Additional permissions should be obtained from the applicable author or publisher of the image. Full text @ Dis. Model. Mech.