
IMAGE
FIGURE 1
- ID
- ZDB-IMAGE-201003-10
- Publication
- Steindal et al., 2020 - Zebrafish Circadian Clock Entrainment and the Importance of Broad Spectral Light Sensitivity
- All Figures
- Figures for Steindal et al., 2020
Image
|
Figure Caption
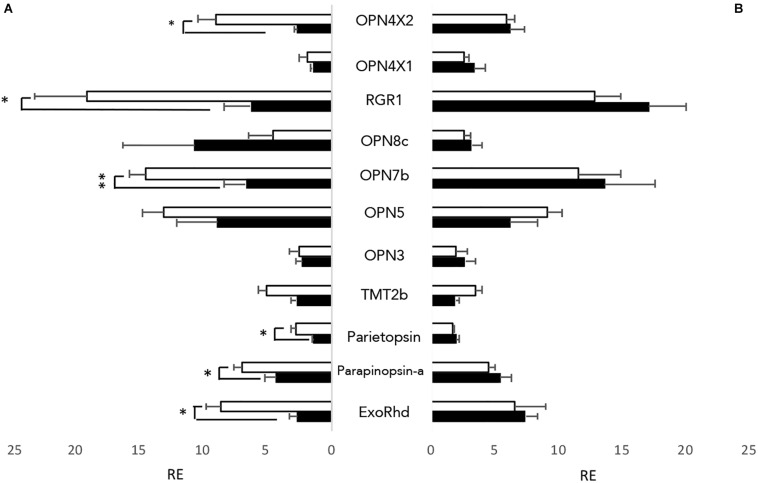
FIGURE 1
Non-visual opsins expressed in zebrafish cell lines. All 32 non-visual opsins were explored by RT-qPCR in entrained zebrafish cell lines at opposite times of day; ZT3 (white) and ZT15 (black). 11 opsins showed detectable expression levels, using a cut-off value of <Cq 30.
Acknowledgments
This image is the copyrighted work of the attributed author or publisher, and
ZFIN has permission only to display this image to its users.
Additional permissions should be obtained from the applicable author or publisher of the image.
Full text @ Front. Physiol.