
Fig. 2
- ID
- ZDB-IMAGE-200928-2
- Publication
- Bloch et al., 2020 - Non-thalamic origin of zebrafish sensory nuclei implies convergent evolution of visual pathways in amniotes and teleosts
- All Figures
- Figures for Bloch et al., 2020
|
Fig. 2
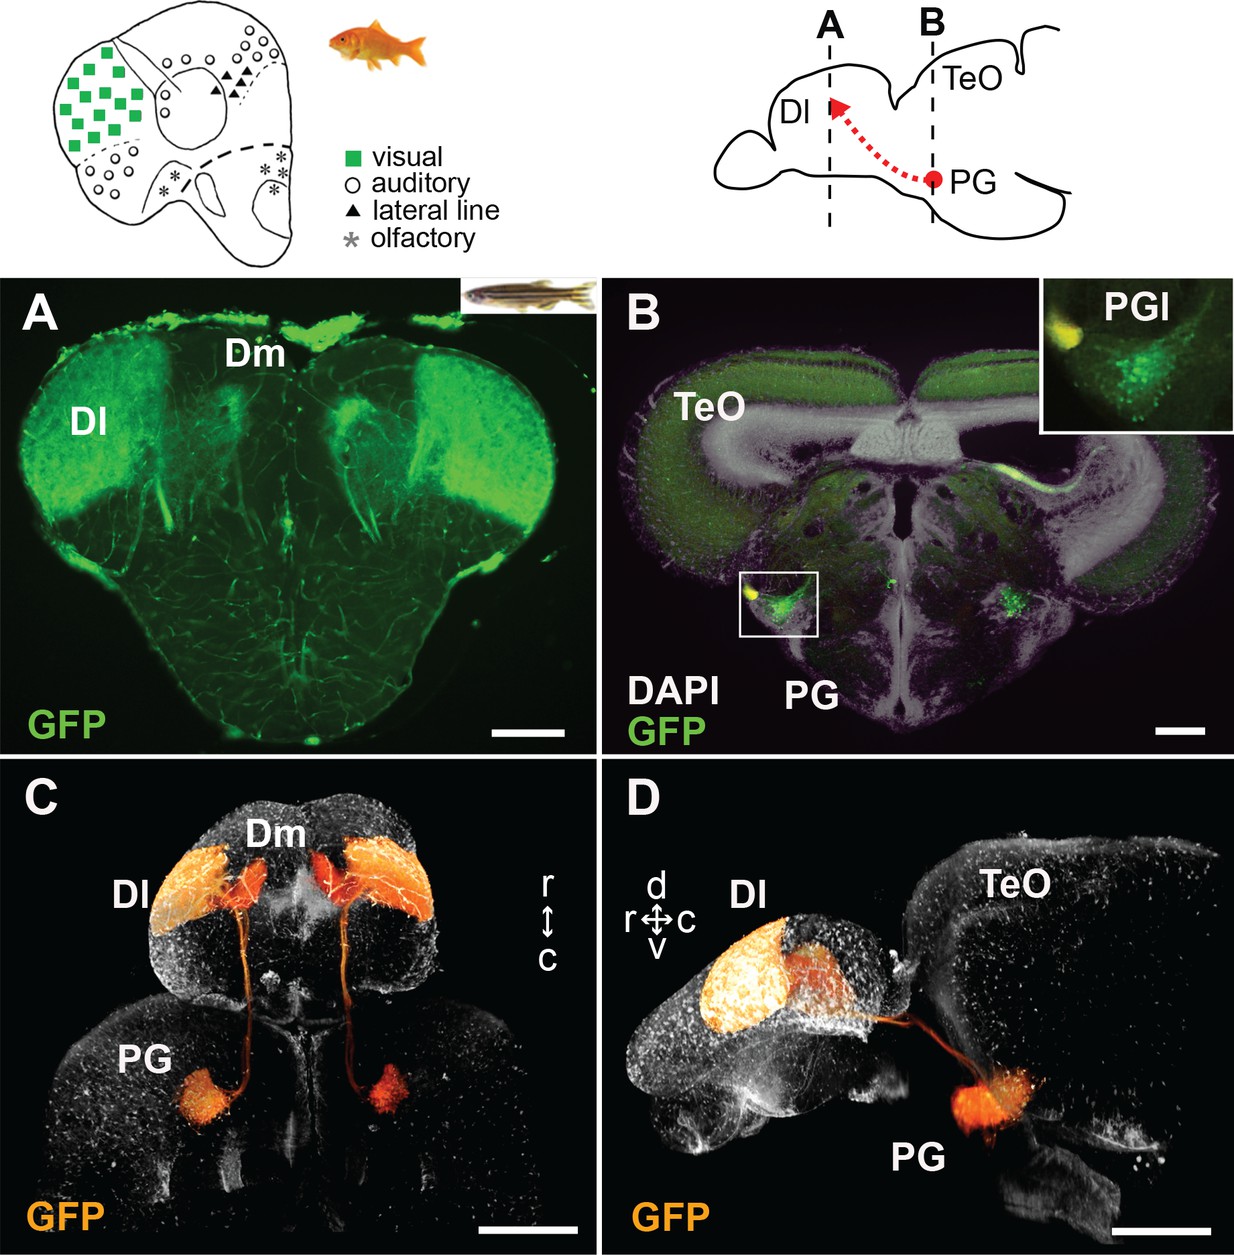
GFP+ afferents in Tg(279A-GFP) zebrafish transgenic line.
(A and B) Frontal sections of Tg(279A-GFP) adult brain showing the GFP+ fibers in Dl of the pallium (A), and GFP+ cell bodies in PG (more specifically, PGl; B). The levels of the frontal sections are indicated on the schematic drawing of a lateral view of the brain (upper right). (A) Abundant GFP+ fibers are found in the zebrafish Dl, which corresponds to the main visual area in the goldfish pallium (upper left schematic drawing adapted from Yamamoto, 2009). (B) A brain section at the level of PG. Higher magnification of the right side of PG is shown in the inset. Based on the nomenclature from goldfish, we define the GFP+ PG cell cluster projecting to the Dl as PGl in the present study. (C and D) Selected visualization of the GFP+ projections from PGl to the pallium. After 3D reconstruction of the whole brain imaging of Tg(279A-GFP), the GFP+ signal of the PGl cells was selectively visualized in order to follow their projections (see Materials and methods). C shows the dorsal view of the brain and D shows the lateral view. The original movie is shown in Video 1. Abbreviations: Dl, lateral part of dorsal telencephalic area; Dm, medial part of dorsal telencephalic area; PG, preglomerular complex; PGl, lateral preglomerular nucleus; TeO, optic tectum. Brain orientation: r, rostral; c, caudal; d, dorsal; v, ventral. Scale bars = 100 µm (A and B); 500 µm (C and D).