
|
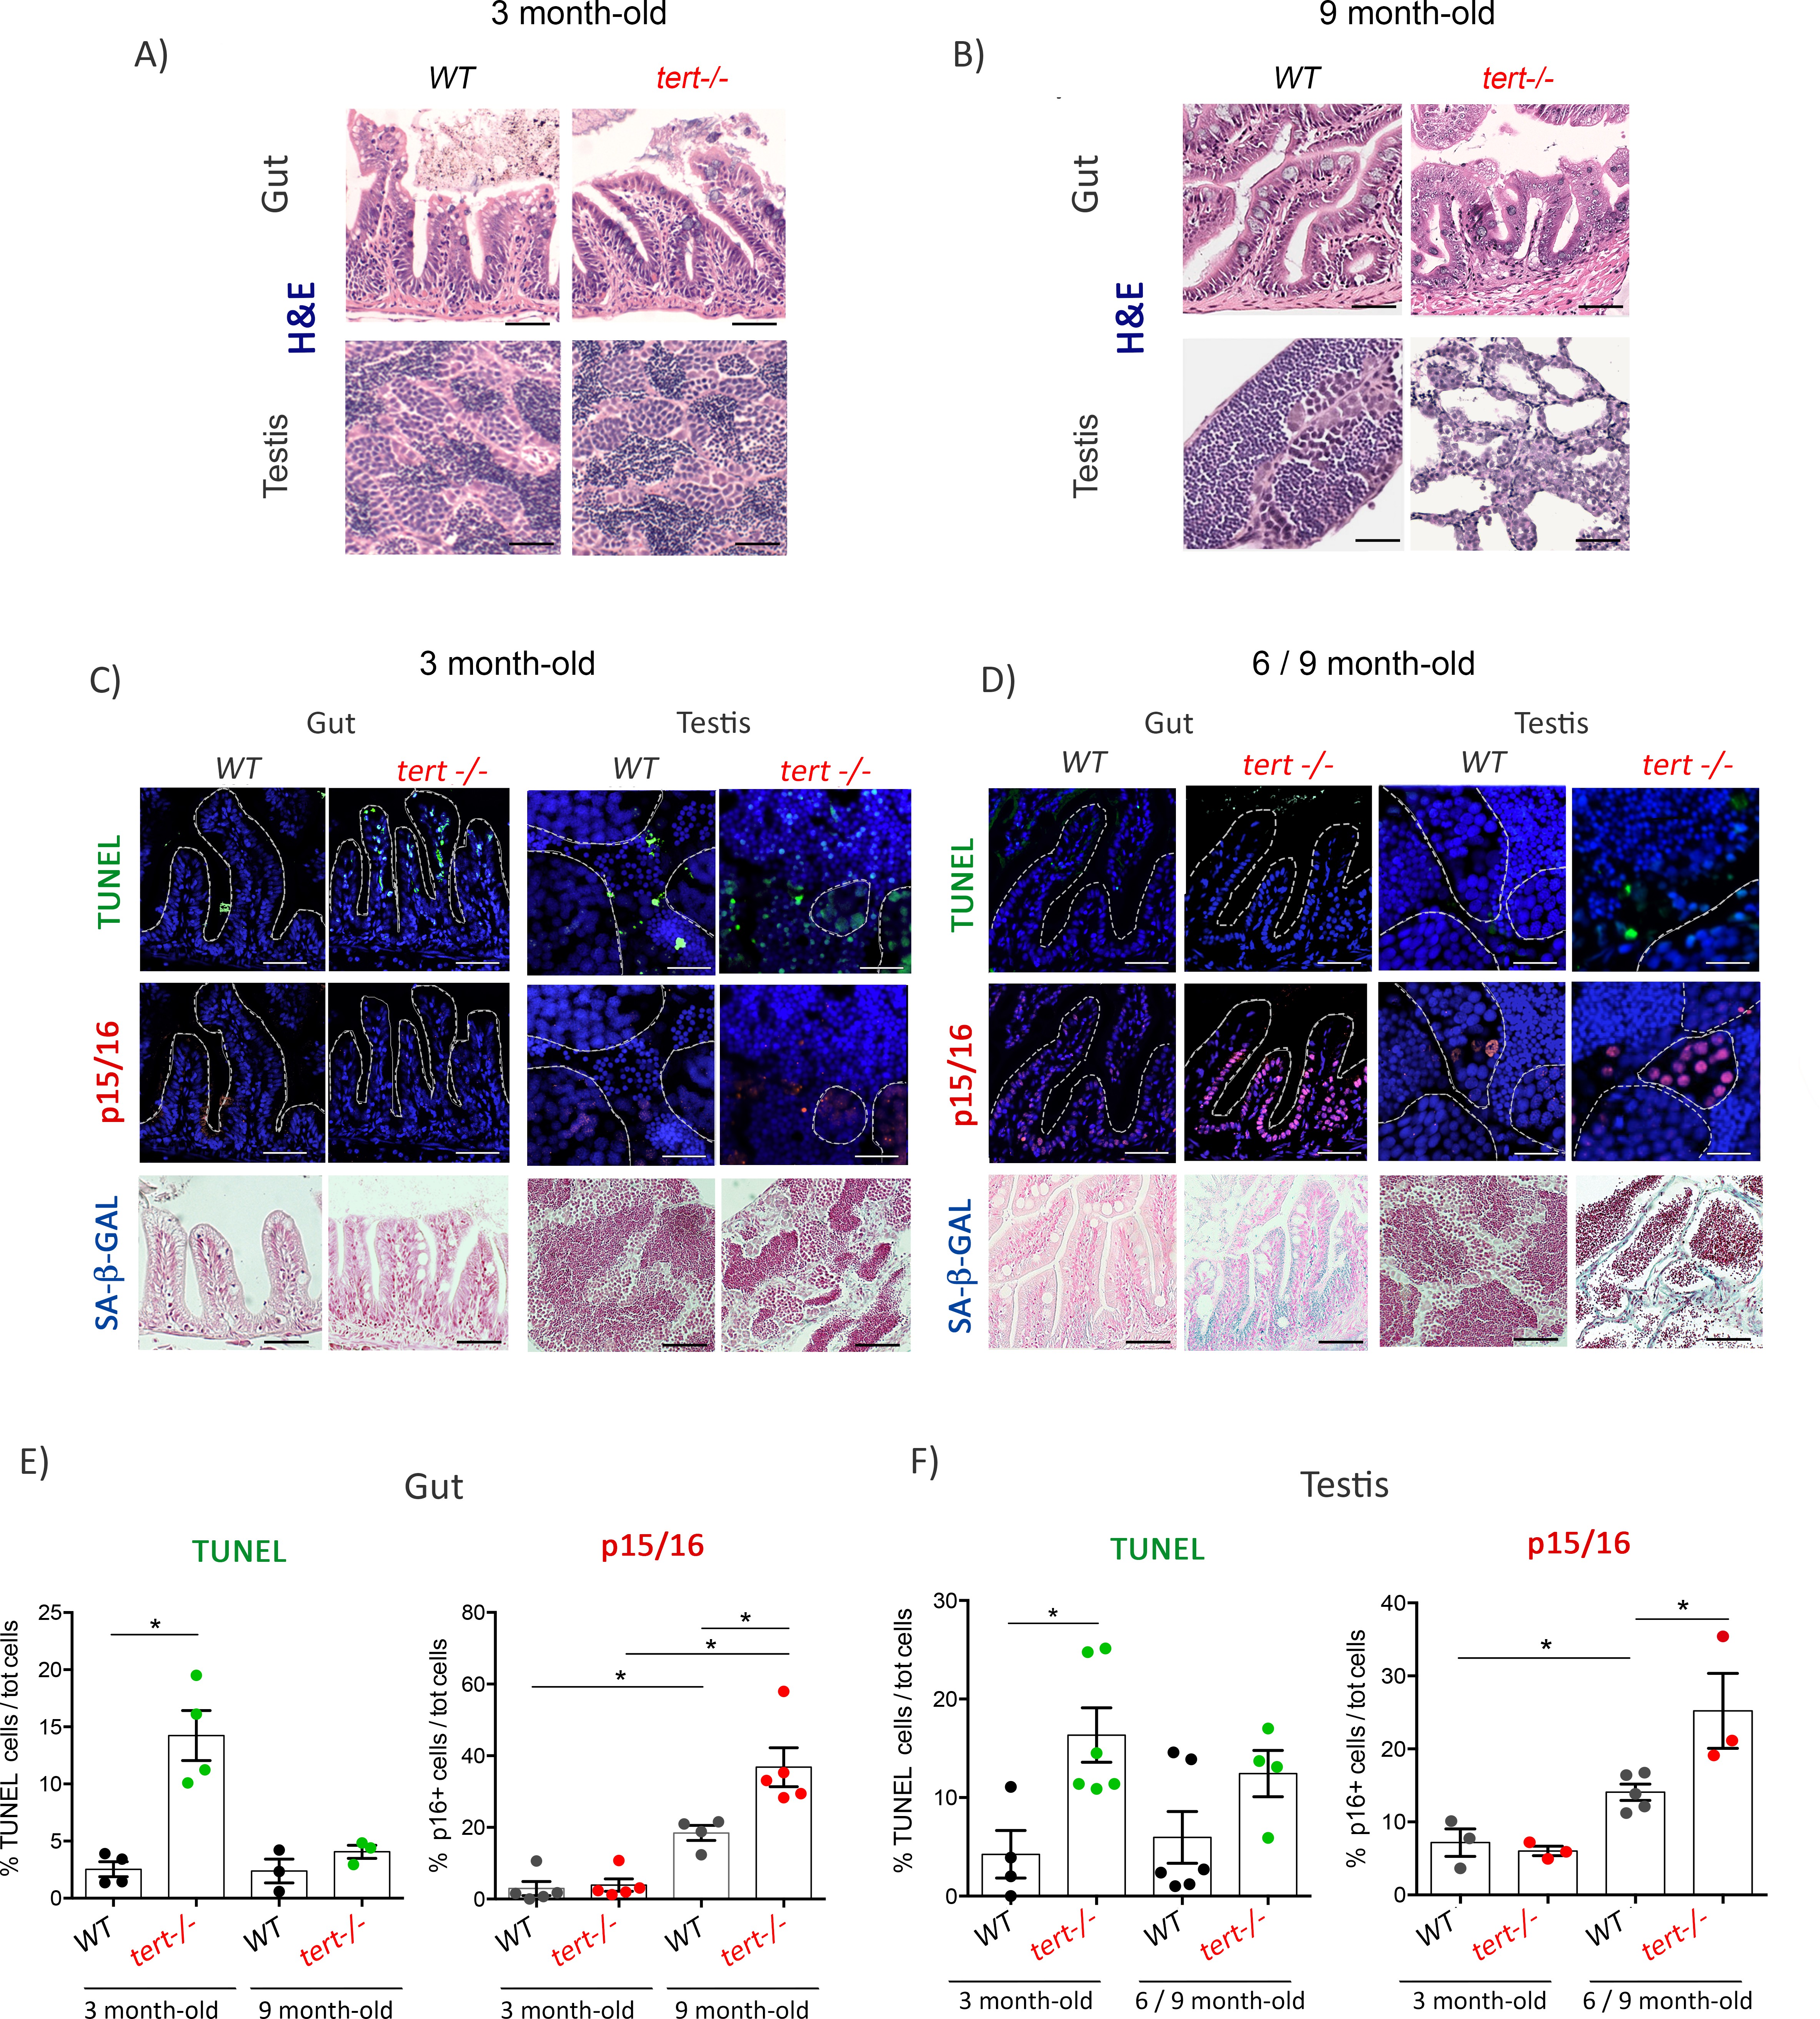
Fig. 1
Proliferative tissues of tert-/- zebrafish undergo an in vivo switch from apoptosis to senescence with age.
(A-B) Representative haematoxylin and eosin-stained sections of gut (scale bar: 40 µm) and testis (scale bar: 25 µm) from 3-month-old (A) or 9-month-old (B) of WT and tert-/- siblings. While no macroscopic tissue defects are distinguishable at 3 months (N = 3), 9 month tert-/- (N = 3) exhibit altered gut and testis structures. (C-D) Representative immunofluorescence images of apoptosis (TUNEL) or senescence (p15/16 and SA-β-GAL) of gut and testis from 3 month (C) or 6–9 month-old (D) WT and tert-/- siblings (N = 3–6 each)(scale bar: 25 µm). Dashed outlines locate cysts of spermogonia cells or spermatocytes (testis) or villi (gut). At 3 months, both tissues show an increased number of apoptotic cells in tert-/- compared to WT. At that age, no signs of senescence are visible in these tissues. However, senescent cells appear in the gut and testis of 6–9 month-old tert-/- fish depicting a switch between apoptosis and senescence. (E-F) Quantification of the percentage of TUNEL and p15/16 positive cells in 3 month and 6–9 month-old tert-/- or WT. Data are represented as mean ± SEM. * p-value<0.05; using the Mann-Whitney test.