
IMAGE
Figure 8
- ID
- ZDB-IMAGE-200905-25
- Publication
- Sone et al., 2020 - Critical roles of the ddx5 gene in zebrafish sex differentiation and oocyte maturation
- All Figures
- Figures for Sone et al., 2020
Image
|
Figure Caption
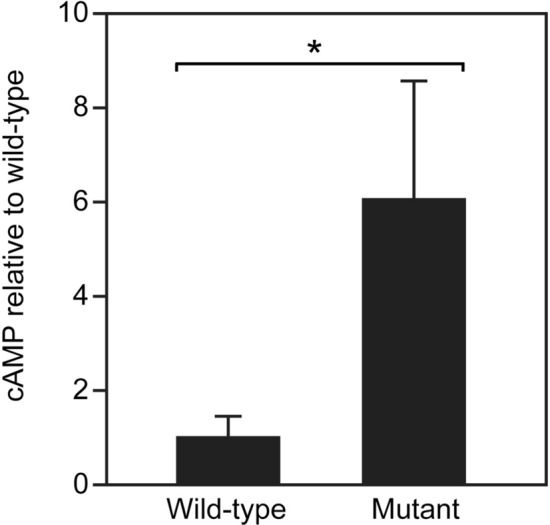
Figure 8
cAMP concentration relative to the wild-type ovaries. The concentration of cAMP in each ovary (wild-type: n = 4,
Figure Data
Acknowledgments
This image is the copyrighted work of the attributed author or publisher, and
ZFIN has permission only to display this image to its users.
Additional permissions should be obtained from the applicable author or publisher of the image.
Full text @ Sci. Rep.