
Image
|
Figure Caption
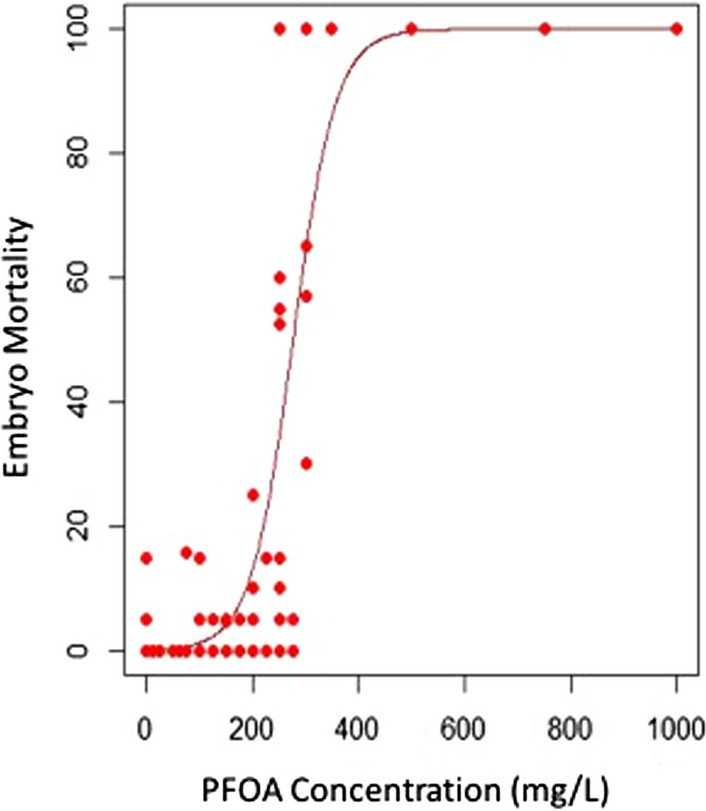
Fig. 1
Concentration–response graph showing acute toxicity and the 48-h LC50 of PFOA in zebrafish embryos. Concentration of PFOA (X-axis) plotted by the probability of mortality (Y-axis) in zebrafish embryos exposed for 48 h resulted in a derived LC50 of 300 mg/L using the ecotoxicity package in R. Each data point represents the average of the replicates from one experiment, and data are presented from five repeated experiments using a range of PFOA concentrations. Each concentration was tested a minimum of three times. Note that the high concentrations all had 100% mortality and those data points overlap
Acknowledgments
This image is the copyrighted work of the attributed author or publisher, and
ZFIN has permission only to display this image to its users.
Additional permissions should be obtained from the applicable author or publisher of the image.
Full text @ BMC Res. Notes