
Image
|
Figure Caption
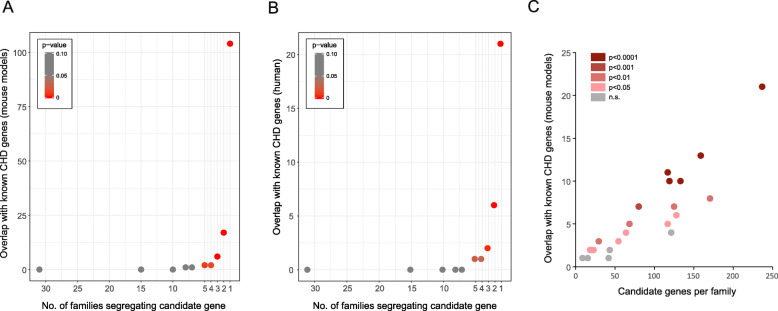
Fig. 2
Enrichment of CHD genes in candidate disease genes. Overlap between CDGs and known CHD genes from mouse models (
Acknowledgments
This image is the copyrighted work of the attributed author or publisher, and
ZFIN has permission only to display this image to its users.
Additional permissions should be obtained from the applicable author or publisher of the image.
Full text @ Genome Med.