
IMAGE
FIGURE 6
- ID
- ZDB-IMAGE-200829-92
- Genes
- Publication
- Min et al., 2020 - Systems Analysis of Biliary Atresia Through Integration of High-Throughput Biological Data
- All Figures
- Figures for Min et al., 2020
Image
|
Figure Caption
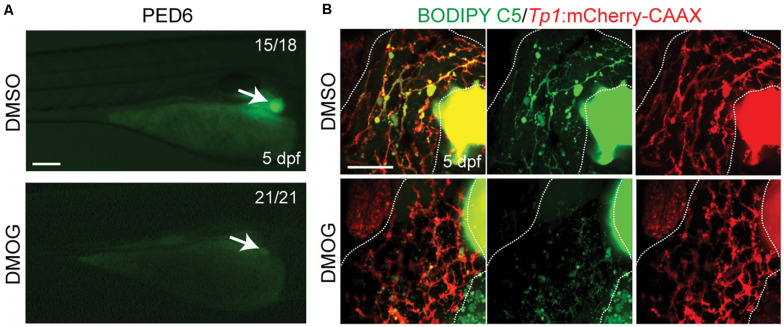
FIGURE 6
Activation of Hif1a signaling impairs biliary morphogenesis.
Figure Data
Acknowledgments
This image is the copyrighted work of the attributed author or publisher, and
ZFIN has permission only to display this image to its users.
Additional permissions should be obtained from the applicable author or publisher of the image.
Full text @ Front. Physiol.