IMAGE

FIGURE 1

ID
ZDB-IMAGE-200829-89
Source
Figures for Min et al., 2020
Image
Figure Caption

FIGURE 1

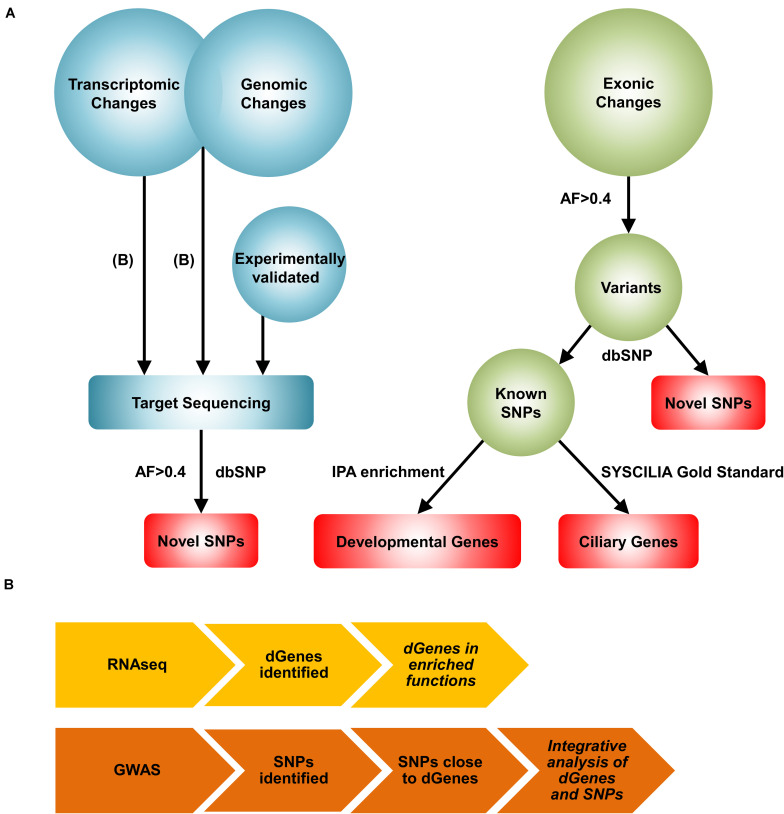
A novel systems biology approach for the reconstruction of the BA network. (A) Workflow of the Systems Biology approach. First, transcriptomic changes were analyzed from the RNAseq data to identify differentially regulated genes in the BA group. The list of differentially regulated genes were then used together with the list of significant genomic changes from the GWAS analysis to identify pairs of significant genes and SNPs. These results, along with experimentally validated genes, were further explored with target sequencing to identify highly common (AF>0.4 and AN>10) novel SNPs. Exomic changes were also examined with whole exome sequencing. From the whole exome data, the dbSNP 138 database was used to identify novel and known SNPs. Developmental genes mapped from the highly common known SNPs were identified using Ingenuity Pathway Analysis (IPA) enrichment. BA-related ciliary genes were identified with the SYSCILIA gold standard list. Red represents the genes and variants considered for the reconstruction of the BA network. AF: allele frequency, AN: total number of alleles. (B) The workflows for the transcriptomic and the integrative analyses are shown. For transcriptomic profiling, RNAseq analysis was performed to identify differentially regulated genes (dGenes). Then, enrichment analysis was performed to identify over-represented biological functions and pathways among dGenes. The integrative analysis involved selection of SNPs near dGenes from the GWAS data and application of set-based test in PLINK to identify pairs of significant genes and SNPs. Italicized results were target sequenced.

Acknowledgments
This image is the copyrighted work of the attributed author or publisher, and ZFIN has permission only to display this image to its users. Additional permissions should be obtained from the applicable author or publisher of the image. Full text @ Front. Physiol.