
IMAGE
FIGURE 1
- ID
- ZDB-IMAGE-200829-74
- Genes
- Publication
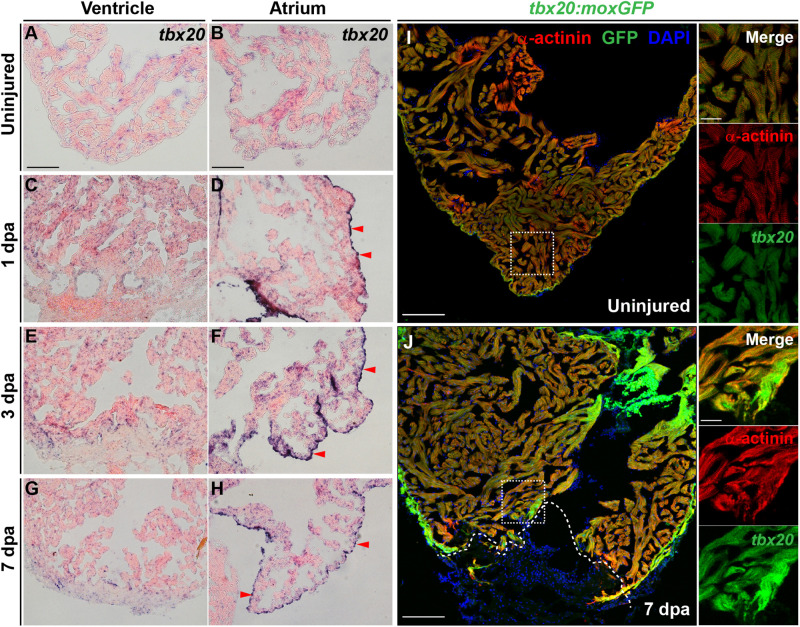
- Fang et al., 2020 - Tbx20 Induction Promotes Zebrafish Heart Regeneration by Inducing Cardiomyocyte Dedifferentiation and Endocardial Expansion
- All Figures
- Figures for Fang et al., 2020
Image
|
Figure Caption
FIGURE 1
Cardiac injury triggers a localized increase in
Figure Data
Acknowledgments
This image is the copyrighted work of the attributed author or publisher, and
ZFIN has permission only to display this image to its users.
Additional permissions should be obtained from the applicable author or publisher of the image.
Full text @ Front Cell Dev Biol