IMAGE

FIGURE 2

ID
ZDB-IMAGE-200829-39
Source
Figures for Muchaamba et al., 2020
Image
Figure Caption

FIGURE 2

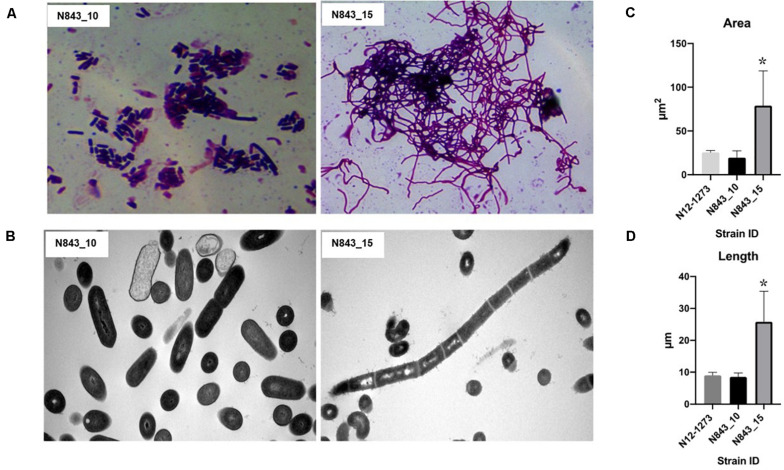
N843_10 and N843_15 cells display morphological differences. (A) N843_15 is filamented whereas N843_10 occurs in single rods and short chains under the light microscope. (B) Electron microscopy (EM) images showing that N843_15 filamentation phenotype is due to chains of unseparated cells whilst N843_10 showed single rods and short chains typical of L. monocytogenes morphology. (C and D) Flow cytometry analysis revealed significantly increased area and cell chain length in N843_15 compared to N843_10 and the clonal control strain N12-1273 (P < 0.05).

Acknowledgments
This image is the copyrighted work of the attributed author or publisher, and ZFIN has permission only to display this image to its users. Additional permissions should be obtained from the applicable author or publisher of the image. Full text @ Front Microbiol