IMAGE

Fig. 6

ID
ZDB-IMAGE-200829-11
Source
Figures for Satapathy et al., 2020
Image
Figure Caption

Fig. 6 LTC<sub>4</sub>-induced 15-PGDH expression negatively regulates GLI1 via CysLT<sub>2</sub>R.

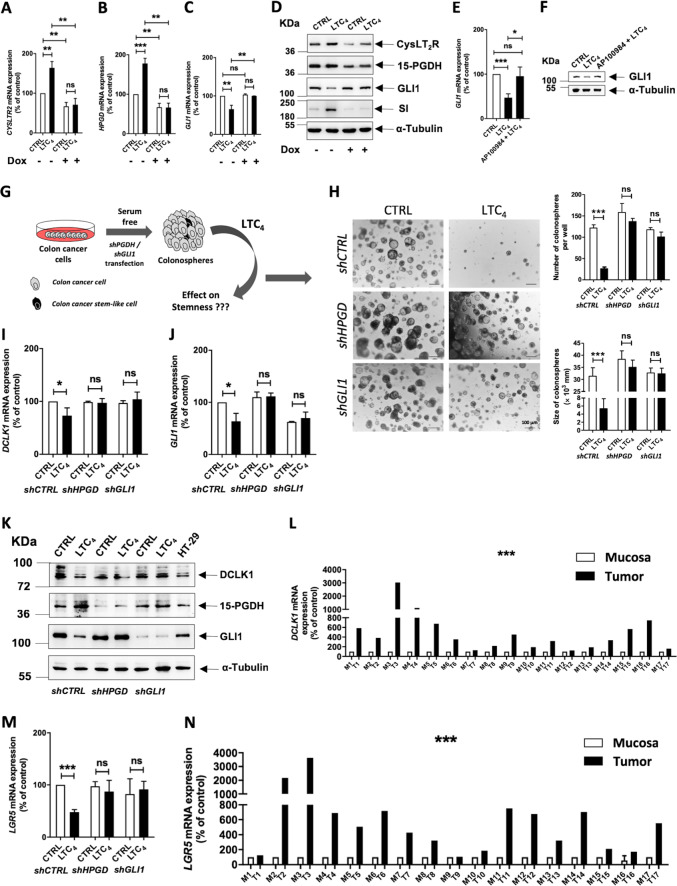
Graphs showing qRT-PCR analysis of aCYSLTR2, b15-PGDH, and cGLI1 mRNA expression in HCT-116 cells with stable transfection of doxycycline-regulated shCYSLTR2 cultured with or without doxycycline (1 µM) treatment followed by LTC4 (40 nM) stimulation for 48 h. d Western blot analysis of CysLT2R, 15-PGDH, GLI1, and SI expression in whole-cell lysates. α-Tubulin served as the loading control. e qRT-PCR analysis showing mRNA expression of GLI1 and f western blot analysis of GLI1 protein expression in HT-29 cells stimulated with or without LTC4 and with or without AP100984 (a CysLT2R antagonist). HPRT1 was used as the housekeeping gene, and α-tubulin was used as the loading control in the western blot assay. g Schematic illustration of colonosphere formation. GLI1 regulates the effect of LTC4 on stemness in multicellular colonospheres. The cells were cultured in ultra-low-attachment conditions on matrigel containing serum-free medium for 14 days. h Representative images of colonospheres from HT-29 cells transfected with shCTRL, shHPGD, or shGLI1 and stimulated or not stimulated with LTC4. Bar graphs showing the number of colonospheres formed per well and the size of colonospheres with or without LTC4 stimulation and comparing the shCTRL-, shHPGD-, and shGLI1-transfected groups. qRT-PCR analysis of the stemness markers iDCLK1, jGLI1, and mLGR5 in colonospheres derived from shCTRL-, shHPGD-, or shGLI1-transfected HT-29 cells with or without LTC4 stimulation for 48 h. k Western blot analysis showing the expression of DCLK1, 15-PGDH, and GLI1 in transfected HT-29 cells as indicated. α-Tubulin served as the loading control. qRT-PCR analysis of lDCLK1 and nLGR5 in matched pairs of mucosa (M) and tumour (T) tissues from CRC patients (n = 17). HPRT1 was used as the housekeeping gene for normalization of the qRT-PCR gene expression data. Data represent the mean ± SEM from 4 to 5 independent experiments, *P < 0.05, **P < 0.01, ***P < 0.001.

Acknowledgments
This image is the copyrighted work of the attributed author or publisher, and ZFIN has permission only to display this image to its users. Additional permissions should be obtained from the applicable author or publisher of the image. Full text @ Oncogenesis