
|
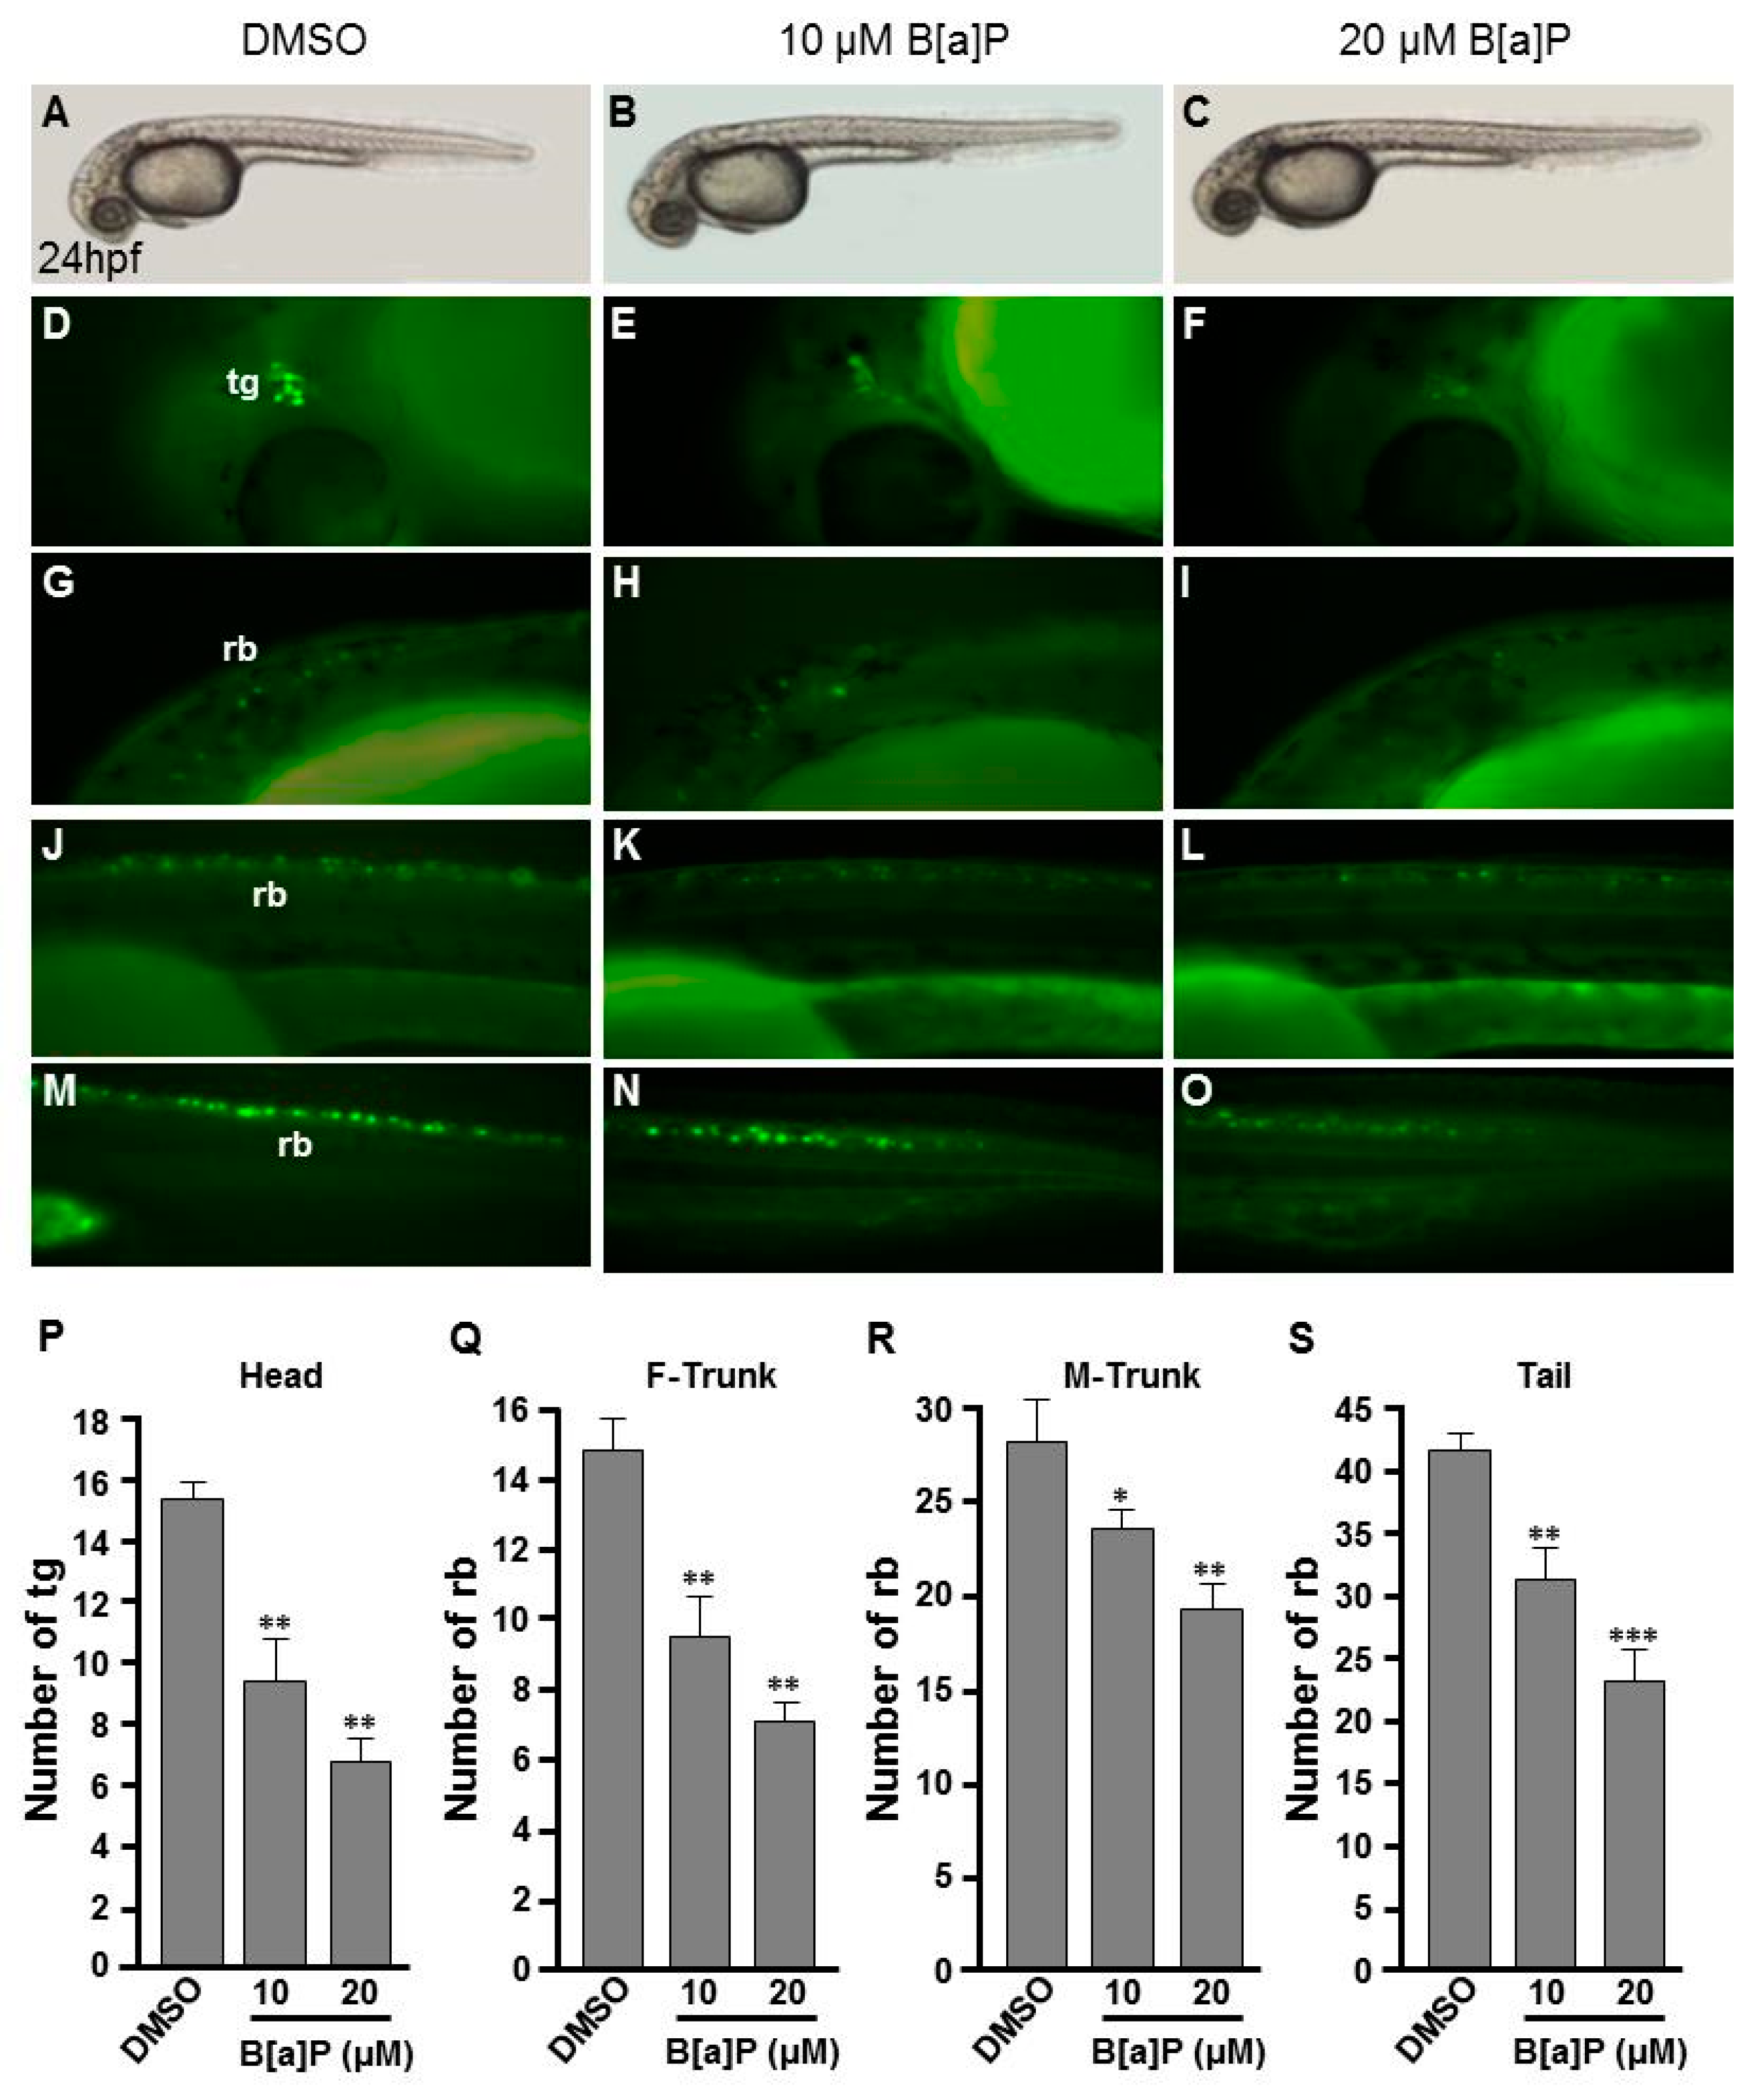
Fig. 1
Developmental neurotoxicity of B[a]P revealed by the Tg(elavl3:EGFP) model. Tg(elavl3:EGFP) zebrafish embryos received the indicated treatments: 0 μM. (control, 01% DMSO; (A,C,F,I,L)), 10-μM B[a]P (B,D,G,J,M) and 20-μM B[a]P (C,E,H,K,N). (A–C) Lateral view of the live embryos at 24 hpf after treatment with 0.1% DMSO (control; A), 10-μM B[a]P (B) and 20-μM B[a]P (C); (D–O) Effects of B[a]P on neurogenesis using the Tg(elavl3:EGFP) model. The embryos treated with 0.1% DMSO (control; (D,G,J,M)), 10-μM B[a]P (E,H,K,N) and 20-μM B[a]P (F,I,L,O) were collected at 24 hpf. Representative fluorescent images are shown for embryonic trigeminal ganglions (tg) in the head region (D–F) and Rohon–Beard cell (rb) in the front trunk (G–I), mid-trunk (J–L) and in tail regions (M–O). (P–S) The numbers of tg cells in the head region and rb cells in front-trunk (F-trunk), mid-trunk (M-Trunk) and tail were counted from 10 embryos in each treatment group. Data are shown as mean ± standard deviation. * p < 0.05, ** p < 0.01, *** p < 0.001 compared with the control.