
Figure 1-S2
- ID
- ZDB-IMAGE-200822-13
- Publication
- Yang et al., 2020 - Drainage of inflammatory macromolecules from brain to periphery targets the liver for macrophage infiltration
- All Figures
- Figures for Yang et al., 2020
|
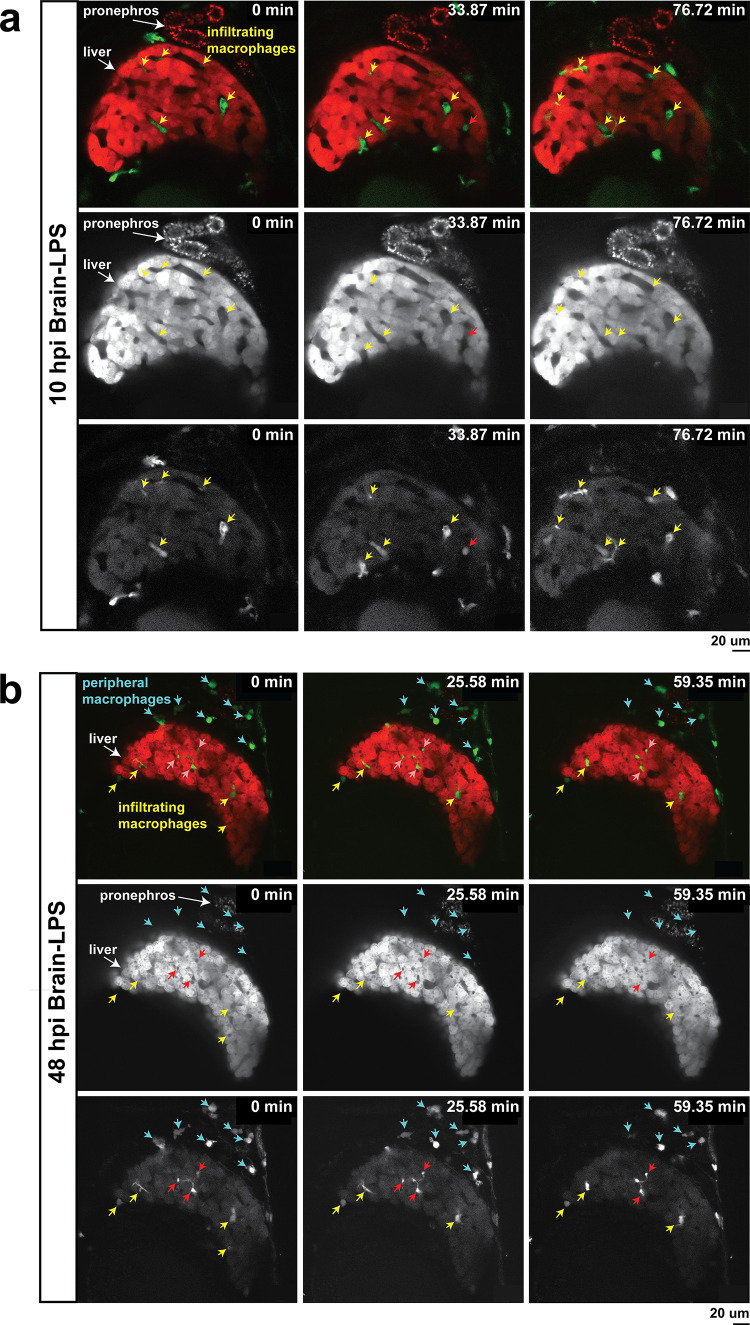
Figure 1-S2
In vivo time-lapse imaging shows dynamic movements and processes of infiltrating macrophages in the liver at short- (10 hpi) and long- (48 hpi) term timepoints after brain-LPS injection.
Single slice images from z-stacks taken using a 40x objective correspond to Videos 1 and 2. (a) Representative single-slice images of three timepoints from time-lapse imaging of macrophage infiltration at 10 hr post injection of LPS in the brain. Top, merged channels of mpeg1:GFPlabeling macrophages and fabp10a:DsRed labeling hepatocytes; middle, DsRed channel showing hepatocytes and pronephros; bottom, GFP channel showing macrophages. Pronephros are labeled because the red fluorescent dextran used as a tracer for the brain injection gets into circulation and is filtered by the pronephros. (b) Representative static single-slice images of the whole liver and macrophages at 48 hpi of LPS in the brain. Yellow arrows, infiltrating macrophages; red arrow in a), circulating monocyte/macrophage; red arrow in b), macrophage with elaborate long processes intercalated between hepatocytes. Blue arrows in b), peripheral macrophages not in the liver.