IMAGE

Fig. 1

ID
ZDB-IMAGE-200819-8
Source
Figures for Gerrard et al., 2020
Image
Figure Caption

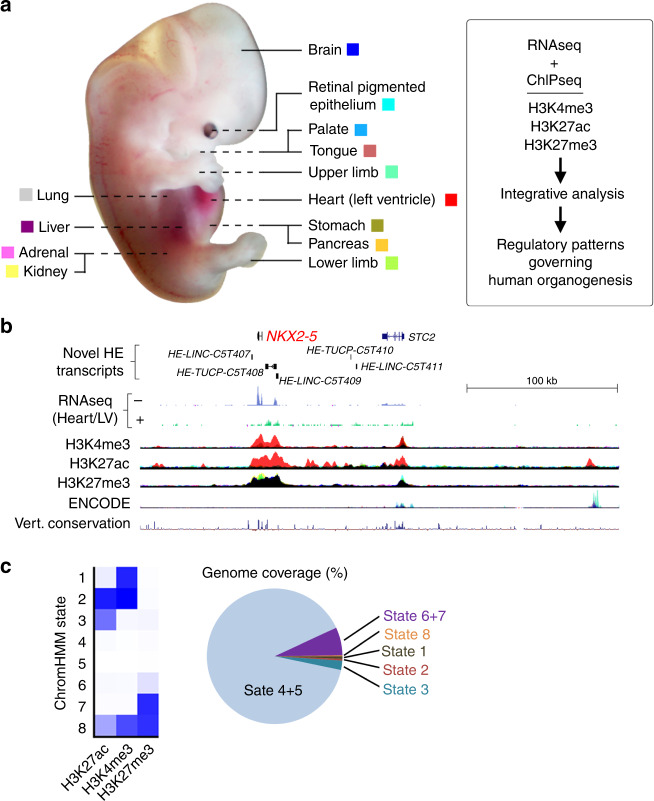
Fig. 1 Epigenomic landscape across 13 human embryonic tissues.

a Thirteen different human embryonic sites were sampled for RNAseq15 and ChIPseq, as described in the “Methods” and in Supplementary Data 1 and 2. The same colour coding for each tissue is applied throughout the paper in overlaid ChIPseq tracks. The heart (left ventricle) dataset is summarised as Heart/LV from hereon. b 300 kb locus around the NKX2-5 gene, the most discriminatory TF gene for human embryonic heart15. The locus contains five unannotated human embryonic (HE) transcripts enriched in heart [three LINC RNAs and two transcripts of uncertain coding potential (TUCP)]. Heart/LV-specific (red) H3K4me3 and H3K27ac marks were detected at the NKX2-5 TSS and adjacent transcripts (HE-TUCP-C5T408 and HE-LINC-C5T409). Embryonic heart-specific H3K27ac marks were visible up to 200 kb away (e.g., at the extreme right of panel). H3K27me3 marked the region from NKX2-5 to HE-LINC-C5T409 in all non-heart tissues (the track appears black from the superimposition of all the different colours other than red). ENCODE data are from seven cell lines26. c Genome coverage by ChromHMM for the different histone modifications was similar across all tissues (Supplementary Fig. 1) with an average 89.8% of the genome unmarked (range: 81.7–94.0; States 4 & 5), and 3.3% consistent with being an active promoter and/or enhancer (range: 1.7–6.1; States 1–3).

Acknowledgments
This image is the copyrighted work of the attributed author or publisher, and ZFIN has permission only to display this image to its users. Additional permissions should be obtained from the applicable author or publisher of the image. Full text @ Nat. Commun.