IMAGE

Figure 2

ID
ZDB-IMAGE-200818-5
Source
Figures for Solis et al., 2020
Image
Figure Caption

Figure 2

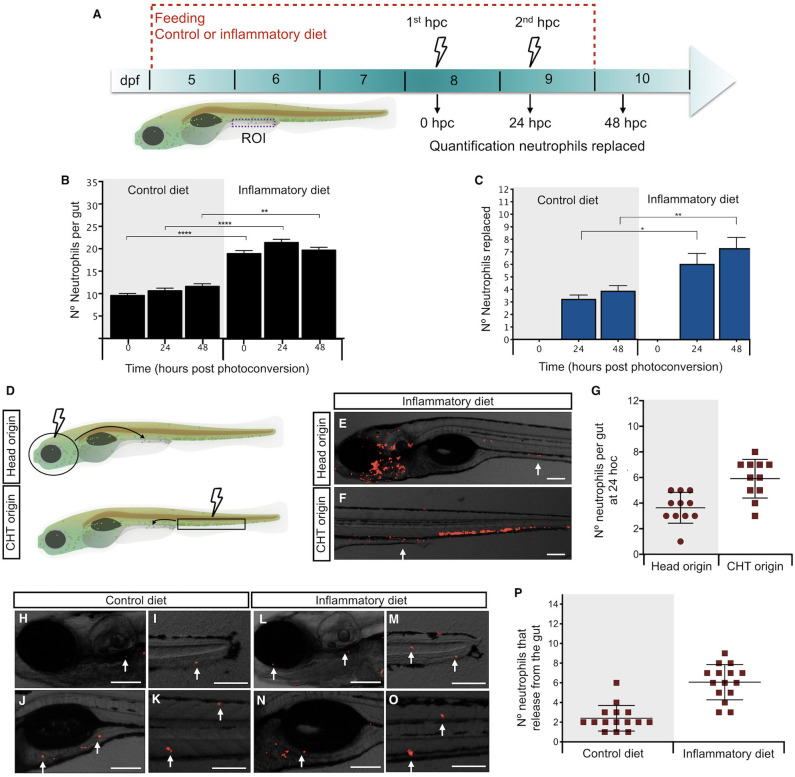
Intestinal inflammation induced by soybean meal increases neutrophil turnover. (A) Experimental strategy used in (B,C,H–P). Larvae at 5 dpf were fed with control or inflammatory diet for 6 days. Then, 1st and 2nd photoconversion of neutrophils present in the intestine was performed at 8 and 9 days post-fertilization (dpf), respectively. Quantification of red- and green-neutrophils present at midintestine (purple dotted line) at 0, 24, and 48 h post-photoconversion (hpc) was performed. (B) Quantification of the total amount of neutrophils present in the intestine at 0, 24, and 48 h post-photoconversion (hpc) in control and inflamed larvae. (C) Quantification of the number of neutrophils replaced at 24 and 48 hpc in control and inflamed larvae. (D) Experimental strategy used in (E–G). The head (circle) or caudal hematopoietic tissue (CHT, rectangle) region was photoconverted at 8 dpf larvae. Later, at 24 hpc red-head-neutrophils and red-CHT-neutrophils present in the intestine were quantified. (E,F) Representative images showing red-head-neutrophil or red-CHT-neutrophils infiltrated in the intestine at 24 hpc in inflamed larvae. (G) Quantification of head and CHT photoconverted neutrophils in the intestine after 24 hpc. (H–O) Representative images showing the region of the body (head, caudal fin, anterior intestine, trunk) where intestine-derived neutrophils were found. (P) Quantification of the number of neutrophils that left the intestine at 24 h. Statistical analysis was performed with the Mann–Whitney U test. ns., non-significant, *p < 0.05, **p < 0.01, and ****p < 0.001. Scale bar, 200 um.

Figure Data
Acknowledgments
This image is the copyrighted work of the attributed author or publisher, and ZFIN has permission only to display this image to its users. Additional permissions should be obtained from the applicable author or publisher of the image. Full text @ Front Immunol