IMAGE

FIGURE 3

ID
ZDB-IMAGE-200818-3
Source
Figures for Okuda et al., 2020
Image
Figure Caption

FIGURE 3

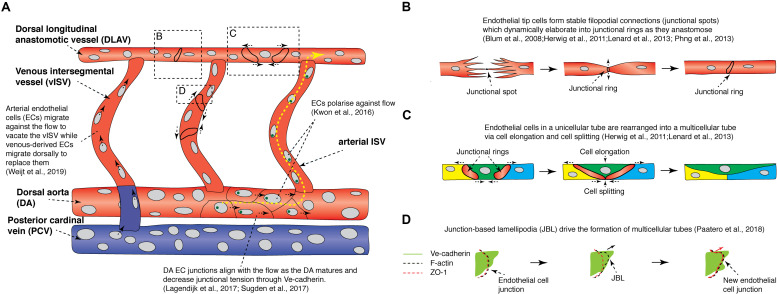
Recent findings from live imaging vessel remodeling and tip cell anastomosis in the zebrafish trunk. (A) Schematic diagram showing events that occur during vessel remodeling and tip cell anastomosis in the zebrafish trunk. Yellow arrows indicate direction of blood flow. Red vessels are arteries while blue vessels are veins. Green circles are golgi bodies. (B) Schematic diagram illustrating the different steps of tip cell anastomosis. A stable filopodial connection is first established (junctional spot), which elaborates into a junctional ring as the cell-cell junction expands. (C) Schematic diagram illustrating how cell elongation and cell splitting occur in the dorsal longitudinal anastomotic vessel to remodel a unicellular tube into a multicellular tube. (D) Endothelial cells migrate on top of each other via junctional-based lamellipodia (JBLs) which emanate from the front end of junctional rings. VE-cadherin provides support for F-actin based JBLs to protrude, driving the ZO-1-positive cell junction to migrate forward toward the front end of the JBL via a ratchet-like mechanism. DA, dorsal aorta; DLAV, dorsal longitudinal anastomotic vessel; EC, endothelial cell; JBL, junction-based lamellipodia; PCV, posterior cardinal vein; vISV, venous intersegmental vessel.

Acknowledgments
This image is the copyrighted work of the attributed author or publisher, and ZFIN has permission only to display this image to its users. Additional permissions should be obtained from the applicable author or publisher of the image. Full text @ Front. Physiol.