IMAGE

Figure 6

ID
ZDB-IMAGE-200814-38
Source
Figures for Lee et al., 2020
Image
Figure Caption

Figure 6

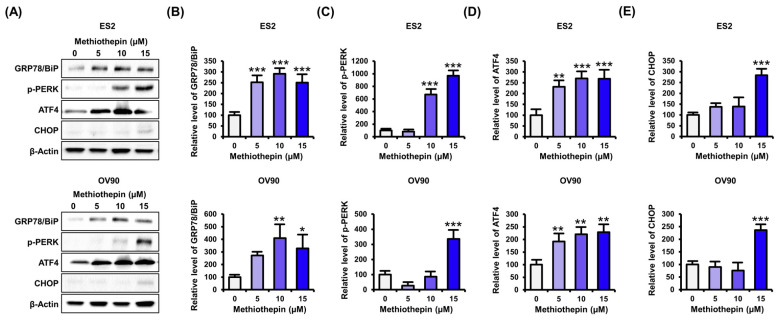
Effects of methiothepin on the expression of ER stress-related proteins in ES2 and OV90 cells. (A) Expression of ER stress-related proteins following methiothepin treatment in ES2 and OV90 cells was analyzed through western blotting. (BE) In order to quantify the expression of (B) GRP78/Bip, (C) p-PERK, (D) ATF4, and (E) CHOP in ES2 and OV90 cells following treatment with methiothepin, the intensity of the band corresponding to each protein was normalized to the β-actin band intensity. The asterisks indicate statistically significant differences compared to the control (* p < 0.05; ** p < 0.01; *** p < 0.001).

Acknowledgments
This image is the copyrighted work of the attributed author or publisher, and ZFIN has permission only to display this image to its users. Additional permissions should be obtained from the applicable author or publisher of the image. Full text @ Pharmaceutics