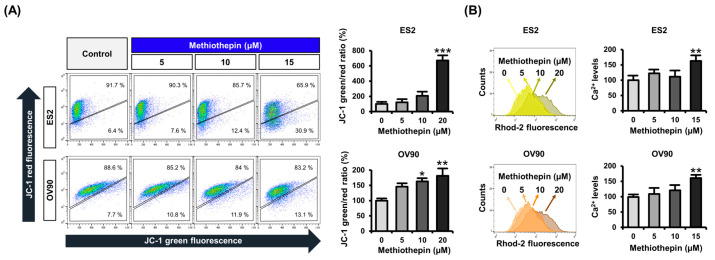
IMAGE

Figure 4

ID
ZDB-IMAGE-200814-36
Source
Figures for Lee et al., 2020
Image
Figure Caption

Figure 4

Effect of methiothepin on mitochondrial membrane potential (ΔΨ) and mitochondrial Ca2+ levels in ES2 and OV90 cells. (A) The change in ΔΨ by methiothepin in ES2 and OV90 cells was analyzed by JC-1 staining. The degree of depolarization of the mitochondrial membrane was determined based on JC-1 green/red ratio. (B) The change of mitochondrial Ca2+ levels in ES2 and OV90 cells following methiothepin treatment was analyzed by staining with the Rhod-2 dye. Results are expressed as the means ± SDs of three independent experiments. The asterisks indicate statistically significant differences compared to the control (* p < 0.05; ** p < 0.01; *** p < 0.001).

Acknowledgments
This image is the copyrighted work of the attributed author or publisher, and ZFIN has permission only to display this image to its users. Additional permissions should be obtained from the applicable author or publisher of the image. Full text @ Pharmaceutics