IMAGE

Figure 1

ID
ZDB-IMAGE-200814-33
Source
Figures for Lee et al., 2020
Image
Figure Caption

Figure 1

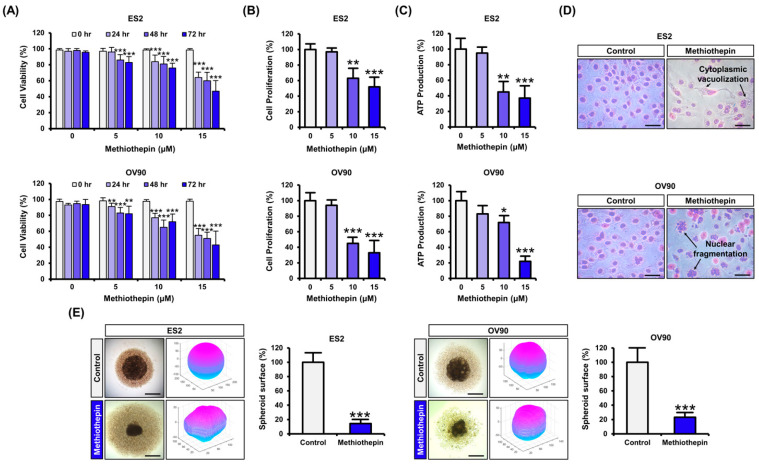
Methiothepin inhibits the viability and proliferation of ES2 and OV90 cells. (A) The viability of ES2 and OV90 cells, in accordance with the dose and duration of treatment with methiothepin, was analyzed by trypan blue exclusion assay. (B) Changes in proliferation of ES2 and OV90 cells following methiothepin treatment were analyzed by trypan blue exclusion assay. (C) The effect of methiothepin on intracellular ATP levels in ES2 and OV90 cells was assessed via colorimetric analysis. (D) Morphological changes of ES2 and OV90 cells following methiothepin treatment were analyzed by Diff-Quik staining. (E) The 3D structure for spheroid formation of ES2 and OV90 cells following methiothepin treatment was quantified using the ReViSP software. Results are expressed as the mean ± SDs of three independent experiments. The asterisks indicate statistically significant differences compared to the control (* p < 0.05; ** p < 0.01; *** p < 0.001). Scale bar indicates 100 μm.

Acknowledgments
This image is the copyrighted work of the attributed author or publisher, and ZFIN has permission only to display this image to its users. Additional permissions should be obtained from the applicable author or publisher of the image. Full text @ Pharmaceutics