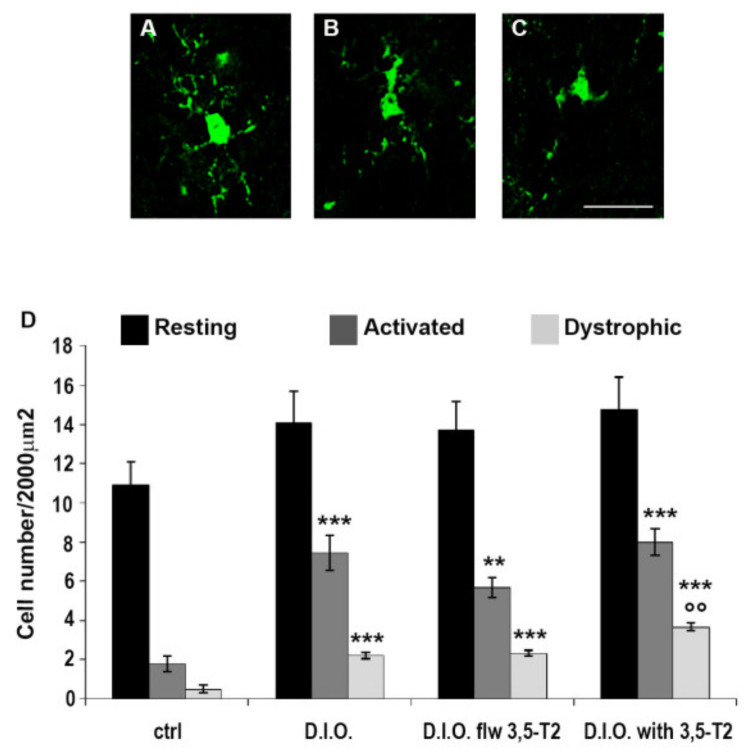
Morphological analysis of microglia in the brain of zebrafish. (A–C) Representative images of different microglial morphology. (A) resting microglia, (B) activated microglia, and (C) dystrophic microglia. Scale bar: 25 μm. (D) Quantitative analysis of the resting, activated, and dystrophic-like cells in the hypothalamus of ctrl (control zebrafish), D.I.O. (diet-induced obesity zebrafish), D.I.O. flw 3,5–T2 (D.I.O. zebrafish followed by 3,5–T2), D.I.O. with 3,5–T2 (D.I.O. zebrafish treated with 3,5–T2). Data are expressed as mean ± SE. *** p < 0.0001, ** p < 0.001 compared to the control group. °° p < 0.05 compared to D.I.O.
Acknowledgments
This image is the copyrighted work of the attributed author or publisher, and
ZFIN has permission only to display this image to its users.
Additional permissions should be obtained from the applicable author or publisher of the image.
Full text @ Animals (Basel)
Your Input Welcome
Thank you for submitting comments. Your input has been emailed to ZFIN curators who may contact you if
additional information is required.
Oops. Something went wrong. Please try again later.