IMAGE

Figure 5

ID
ZDB-IMAGE-200811-35
Source
Figures for Brinza et al., 2020
Image
Figure Caption

Figure 5

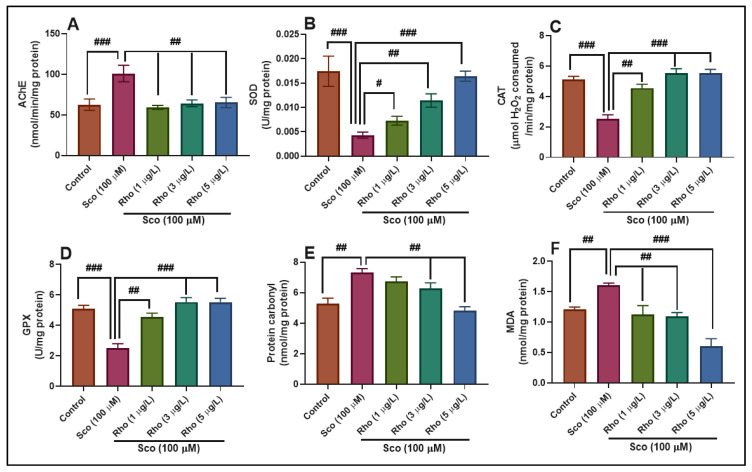
Rhoifolin (Rho: 1, 3, and 5 μg/L) exhibited an anti-AChE effect and improved the antioxidant status in the zebrafish brain. (AD) Representation of the enzymes’ specific activity (AChE, SOD, CAT, and GPX) in different groups; (E,F) Representation of the protein carbonyl and MDA levels in different groups. Values are means ± S.E.M. (n = 10). For Tukey’s post hoc analyses: (A) Control vs. Sco (100 µM): ### p < 0.0001, Sco vs. Rho (1 µg/L): ## p < 0.001, Sco vs. Rho (3 µg/L): ## p < 0.001 and Sco vs. Rho (5 µg/L): ## p < 0.001; (B) Control vs. Sco (100 µM): ### p < 0.0001, Sco vs. Rho (1 µg/L): # p < 0.01, Sco vs. Rho (3 µg/L): ## p < 0.001 and Sco vs. Rho (5 µg/L): ### p < 0.0001; C. Control vs. Sco (100 µM): ### p < 0.0001, Sco vs. Rho (1 µg/L): ## p < 0.001, Sco vs. Rho (3 µg/L): ### p < 0.0001 and Sco vs. Rho (5 µg/L): ### p < 0.0001; (D) Control vs. Sco (100 µM): ### p < 0.0001, Sco vs. Rho (1 µg/L): ## p < 0.001, Sco vs. Rho (3 µg/L): ### p < 0.0001 and Sco vs. Rho (5 µg/L): ### p < 0.0001; (E) Control vs. Sco (100 µM): ## p < 0.001, Sco vs. Rho (3 µg/L): ## p < 0.001 and Sco vs. Rho (5 µg/L): ## p < 0.001; and (F) Control vs. Sco (100 µM): ## p < 0.001, Sco vs. Rho (1 µg/L): ## p < 0.001, Sco vs. Rho (3 µg/L): ## p < 0.001 and Sco vs. Rho (5 µg/L): ### p < 0.0001.

Figure Data
Acknowledgments
This image is the copyrighted work of the attributed author or publisher, and ZFIN has permission only to display this image to its users. Additional permissions should be obtained from the applicable author or publisher of the image. Full text @ Antioxidants (Basel)