IMAGE

Figure 3

ID
ZDB-IMAGE-200811-33
Source
Figures for Brinza et al., 2020
Image
Figure Caption

Figure 3

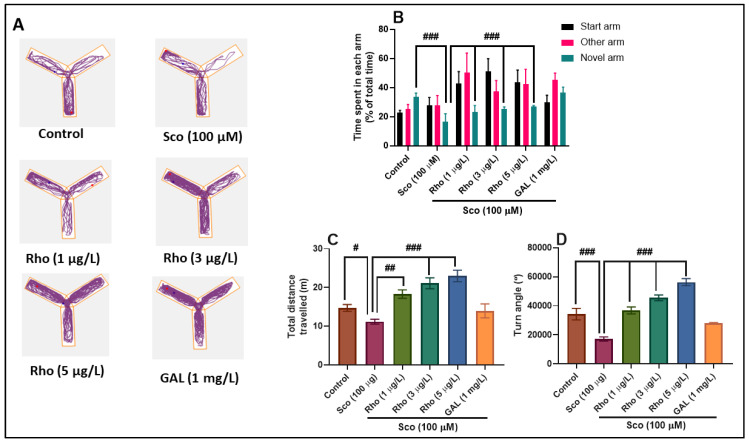
Rhoifolin (Rho: 1, 3, and 5 μg/L) improved the locomotion pattern and memory in the Y-maze test. (A) Representative locomotion tracking pattern of the control, scopolamine (Sco: 100 µM), rhoifolin (Rho: 1, 3, and 5 µg/L) and galantamine (GAL: 1 mg/L) treated groups. (B) Representation of the time spent in each arm (start, other, and novel arm) in different groups. (C) Representation of the total distance traveled by zebrafish in the tank in different groups. (D) Representation of the turn angle of zebrafish in the tank in different groups. Values are means ± S.E.M. (n = 10). For Tukey’s post hoc analyses: (B) Control vs. Sco (100 µM): ### p < 0.0001, Sco vs. Rho (1 µg/L): ### p < 0.0001, Sco vs. Rho (3 µg/L): ### p < 0.0001, and Sco vs. Rho (5 µg/L): ### p < 0.0001; (C) Control vs. Sco (100 µM): # p < 0.01, Sco vs. Rho (1 µg/L): ## p < 0.001, Sco vs. Rho (3 µg/L): ### p < 0.0001, and Sco vs. Rho (5 µg/L): ### p < 0.0001; (D) Control vs. Sco (100 µM): ### p < 0.0001, Sco vs. Rho (1 µg/L): ### p < 0.0001, Sco vs. Rho (3 µg/L): ## p < 0.0001, and Sco vs. Rho (5 µg/L): ## p < 0.0001.

Figure Data
Acknowledgments
This image is the copyrighted work of the attributed author or publisher, and ZFIN has permission only to display this image to its users. Additional permissions should be obtained from the applicable author or publisher of the image. Full text @ Antioxidants (Basel)